backlog for Gantt chart
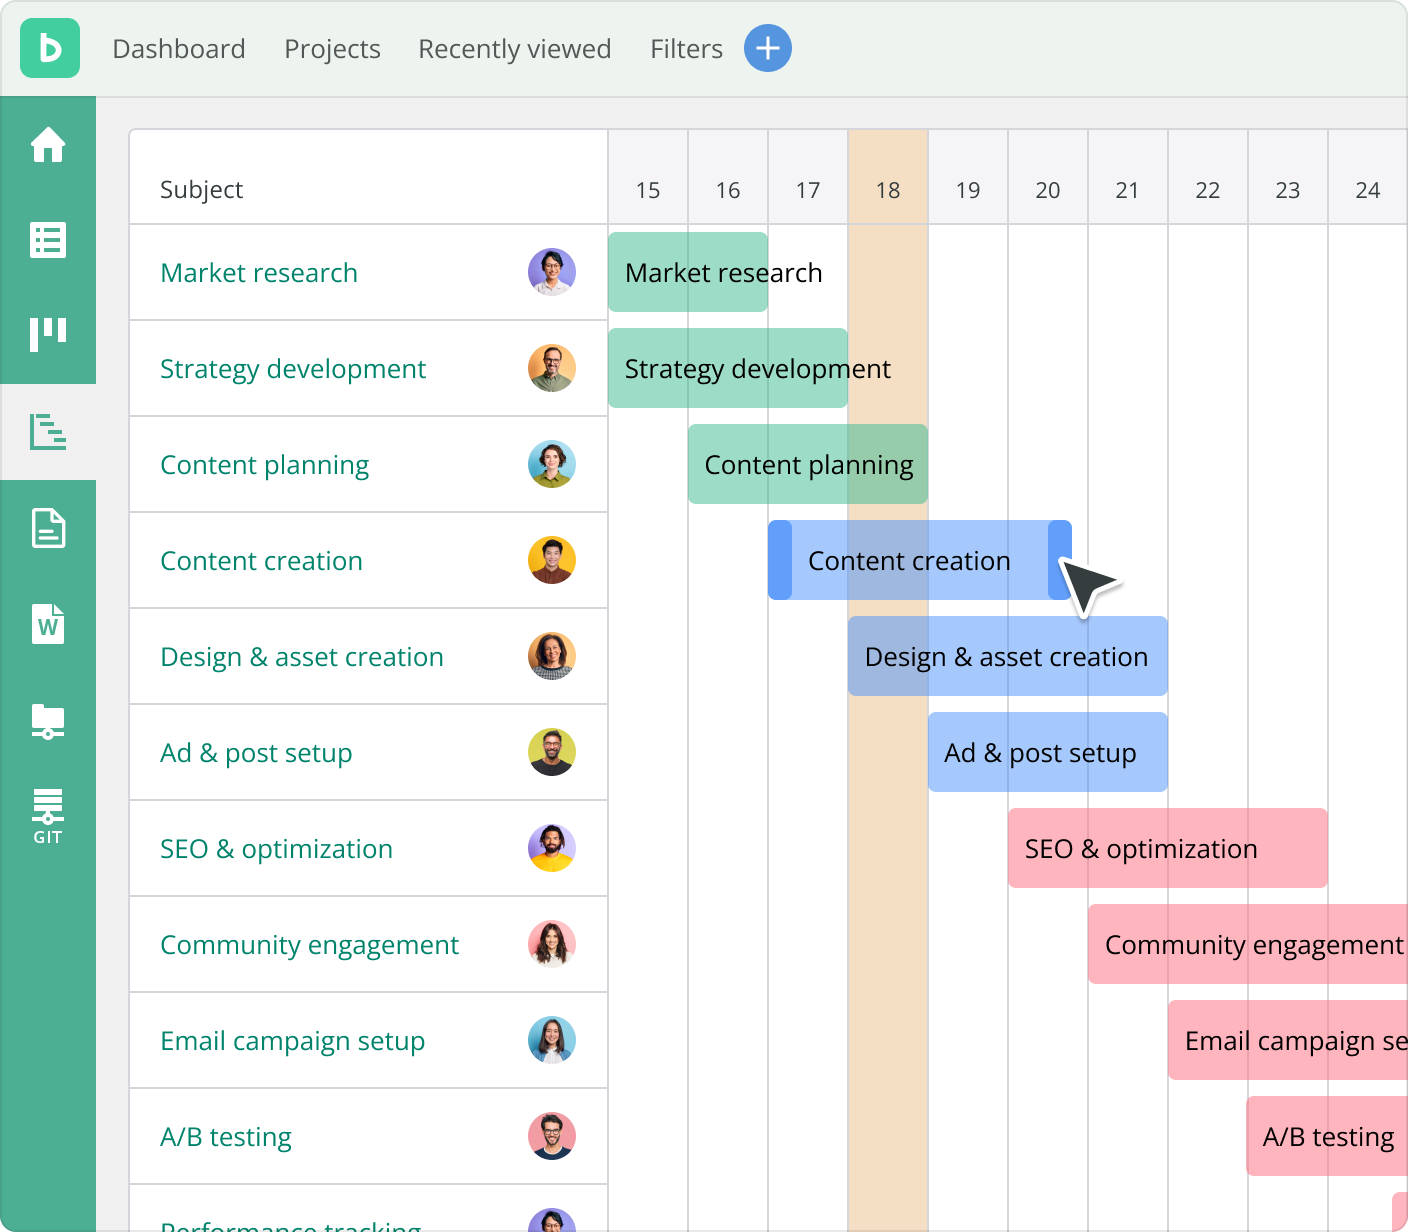
Automatically visualize your team’s project plan with Gantt charts generated from your team’s tasks.
Stay ahead of the curve
See upcoming deadlines and know who’s working on what.
Prioritize what matters
Prioritize issues by urgency to get the right things done first.
Project management, supercharged with AI
Old way
New way
Multiple tabs
Info overload
Backlog chaos
Missed blockers
Manual reporting
One AI-powered workspace
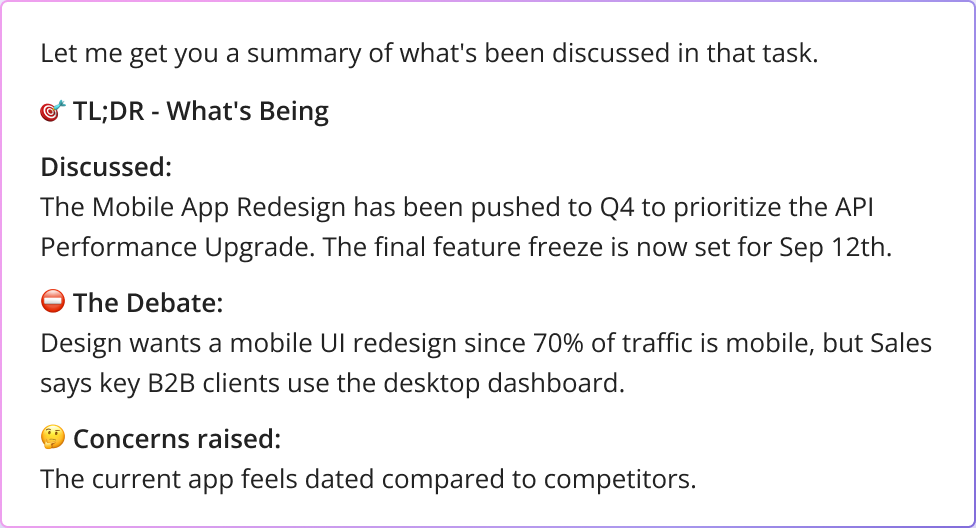
Summaries in seconds
Prioritized projects
Reveal risks on demand
Generate instant insights
What was actually decided in the 'Q3 Product Roadmap' task? There are over 50 comments and I’ve lost the thread."
Quickly spot tasks that may require more time or teamwork.
Every Backlog user has their own personal Gantt chart.
Drag and drop the timeline bar to change dates or update task details in bulk.
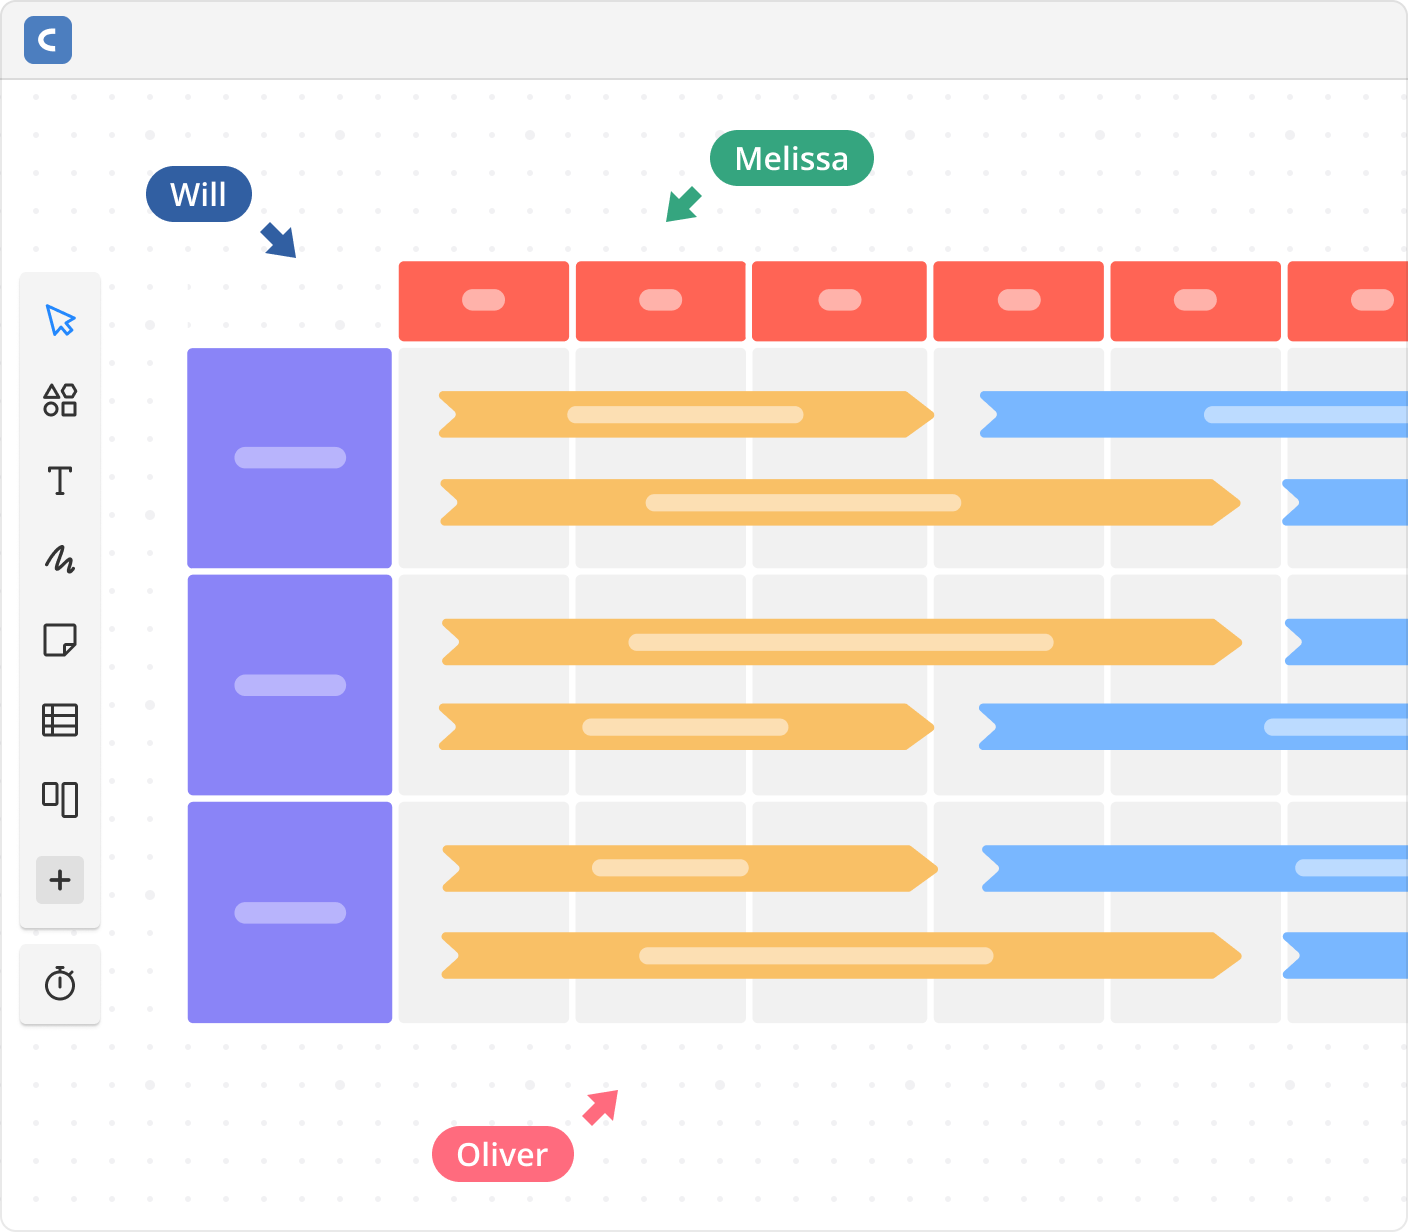
cacoo for Gantt chart
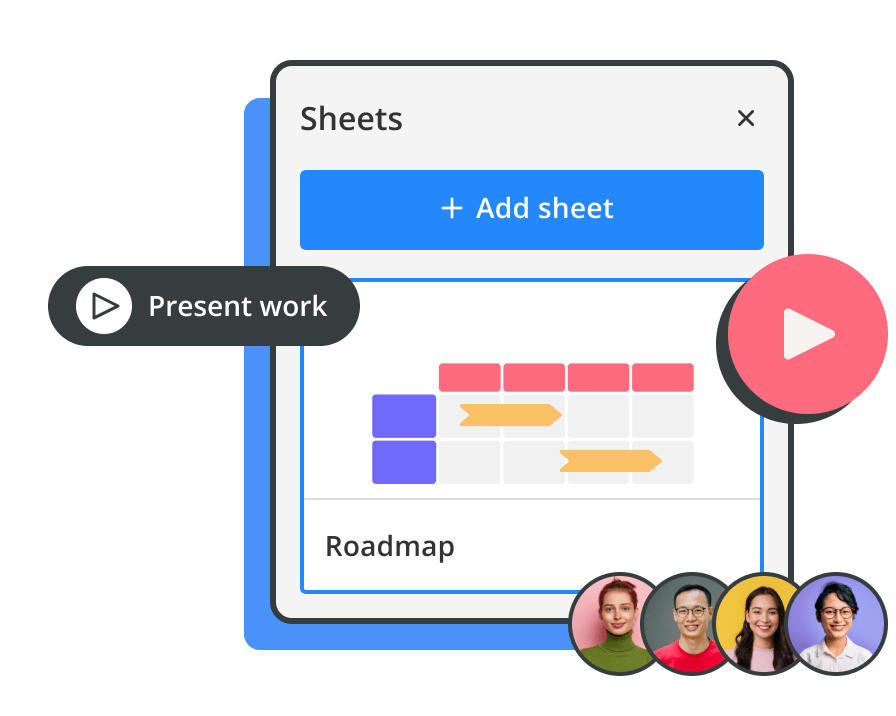
Create Gantt charts from scratch to plan and visualize upcoming projects.
Visual project progress
Gantt chart templates help you quickly create diagrams together in real-time.
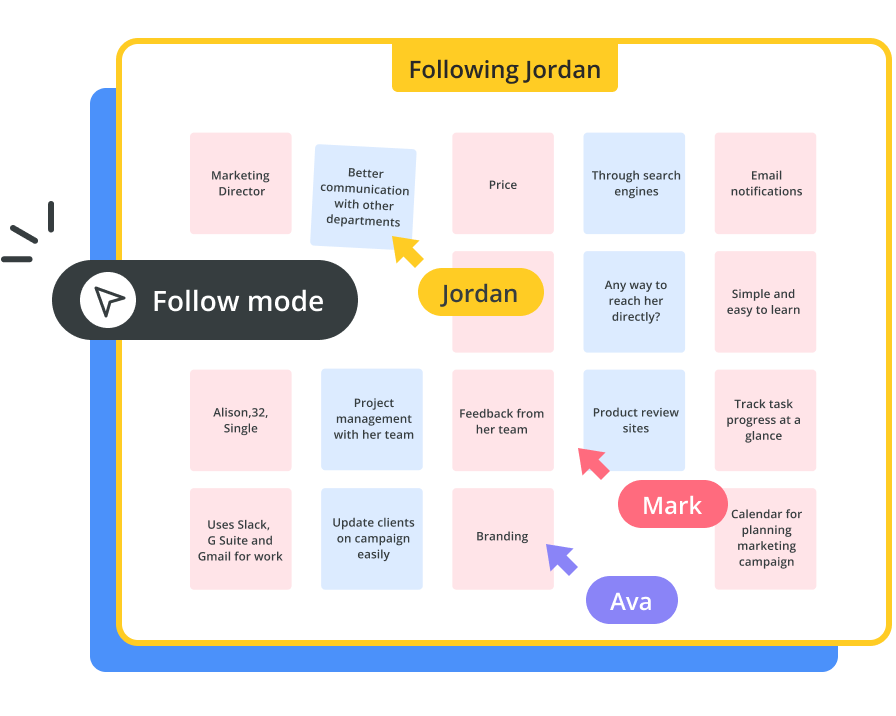
Easy collaboration
Work on the same diagram at the same time with your team.
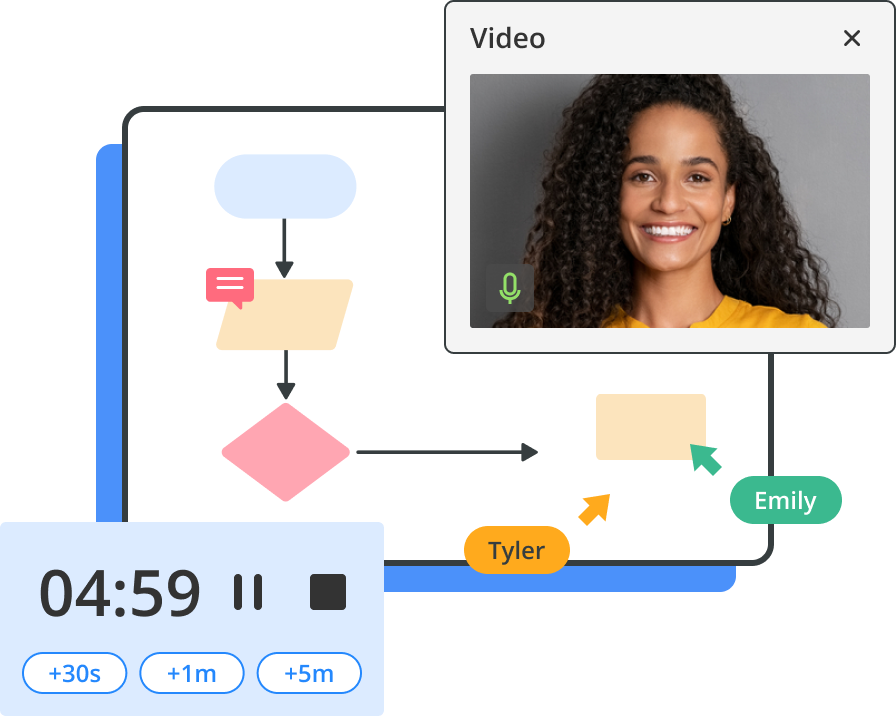
Get instant feedback
Discuss timelines using comments, chat, and video chat.
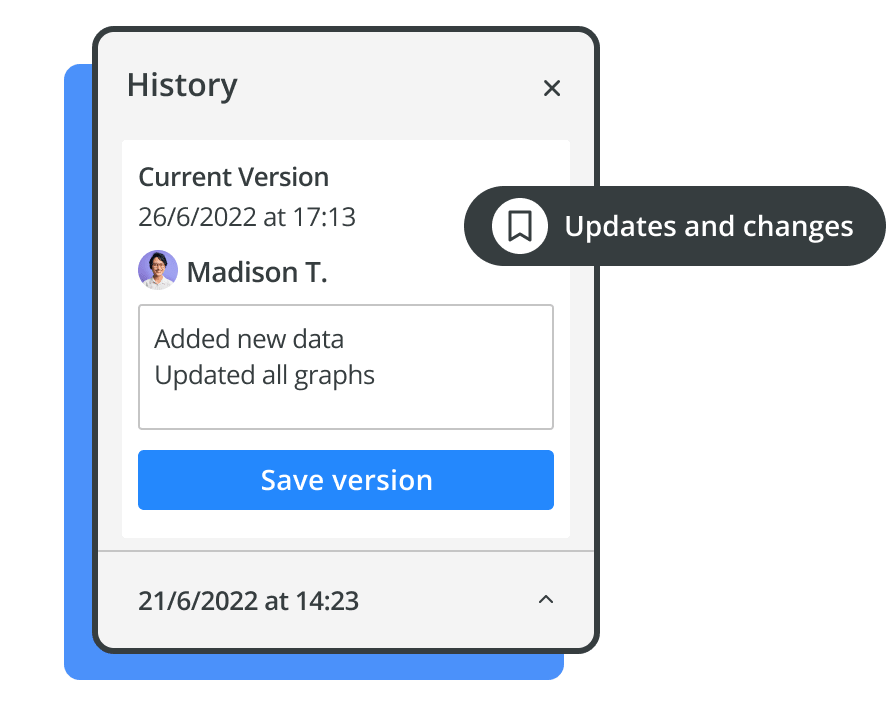
Track progress over time
Save versions with version history, so you never lose an iteration.
Frequently Asked Questions
4 MILLION PEOPLE USE NULAB PRODUCTS WORLDWIDE TO BRING THEIR IDEAS TO LIFE


