Dynamic diagramming is a powerful tool that can help you build a better foundation for any project. Designers, developers, marketers, and project managers all learn by diagramming their ideas and collaborating.
Think about it. How often do you search for an image, slideshow, or video when you’re trying to understand something new?
Processing dense information is difficult for most people. Visuals help you connect the dots between different data types and understand the big picture.
If you want to communicate effectively with your team or clients, use diagramming to express ideas and get results.
How to use business diagramming to improve operations
Optimize communication
From flowcharts to mind maps, diagrams communicate the macro and micro details to everyone involved. Imagery is a language that bridges the melting pot of teams who make a project come to life. Programmers can collaborate with designers, and clients with contractors, all reading the visual blueprints created through diagramming.
Simply put, clear communication leads to efficiency.
Diagrams provide a reference point for your whole team, and they leave less room for misinterpretation. Every team member can use the data to take action on their tasks and see the core thought process behind business decisions.
Chika Tsunoda, CEO of the skill-sharing service ANYTIMES, is an avid user of Cacoo, Nulab’s diagramming toolkit. In a conversation with her, she relayed just how invaluable diagramming was to the communication process of creating her product:
“It was important that we communicated what we wanted to make. So, with the creation of the wireframe, we reached out about this work to the people at the systems company and to the freelance engineers […] and through Cacoo we were able to tell them what we wanted to make, and immediately communication became smooth.” – Chika Tsunoda, CEO of ANYTIMES
Develop the best ideas
Not all ideas are created equally. Often, it’s necessary to pick apart ideas to find the flaws and decide which projects are viable. Diagramming is useful for brainstorming because it allows you to organize large volumes of information. Most importantly, you gain a clear sense of what to prioritize.
All teams have periods of conflict where people struggle with opposing ideas. In many cases, a team member suggests a process or idea that seems good in their head. Yet, it’s less practical when you break down the details.
By working things out visually, teams can better share constructive feedback. Team members are able to see all the pros and cons of moving forward with a project, which may be more imbalanced than they first realized. And the faster you get everyone on the same page, the sooner you can get started on more beneficial projects.
Identify opportunities for growth
Diagramming encourages teams to evaluate problems more thoroughly. In fact, you may even identify opportunities that are harder to spot when the information’s disjointed.
Let’s say your team analyzes marketing activities to decide how to spend the budget. You discover that the channels that drive the most engagement aren’t leading to the most conversions. This data is confusing if you look at each marketing channel separately. However, combining the data in one diagram makes it easier to study the relationships between different channels. Suddenly you’re able to see common paths to conversion.
What you think you know doesn’t always match up to reality. For example, departments that work in silos are prone to information gaps. Projects don’t run smoothly because each team is making decisions individually.
Therefore, it saves time and resources to share information and solve problems together. Compile data in meaningful ways, and you can remove bias and assumptions from key business processes.
5 essential diagramming projects you should try
Business & project management diagrams
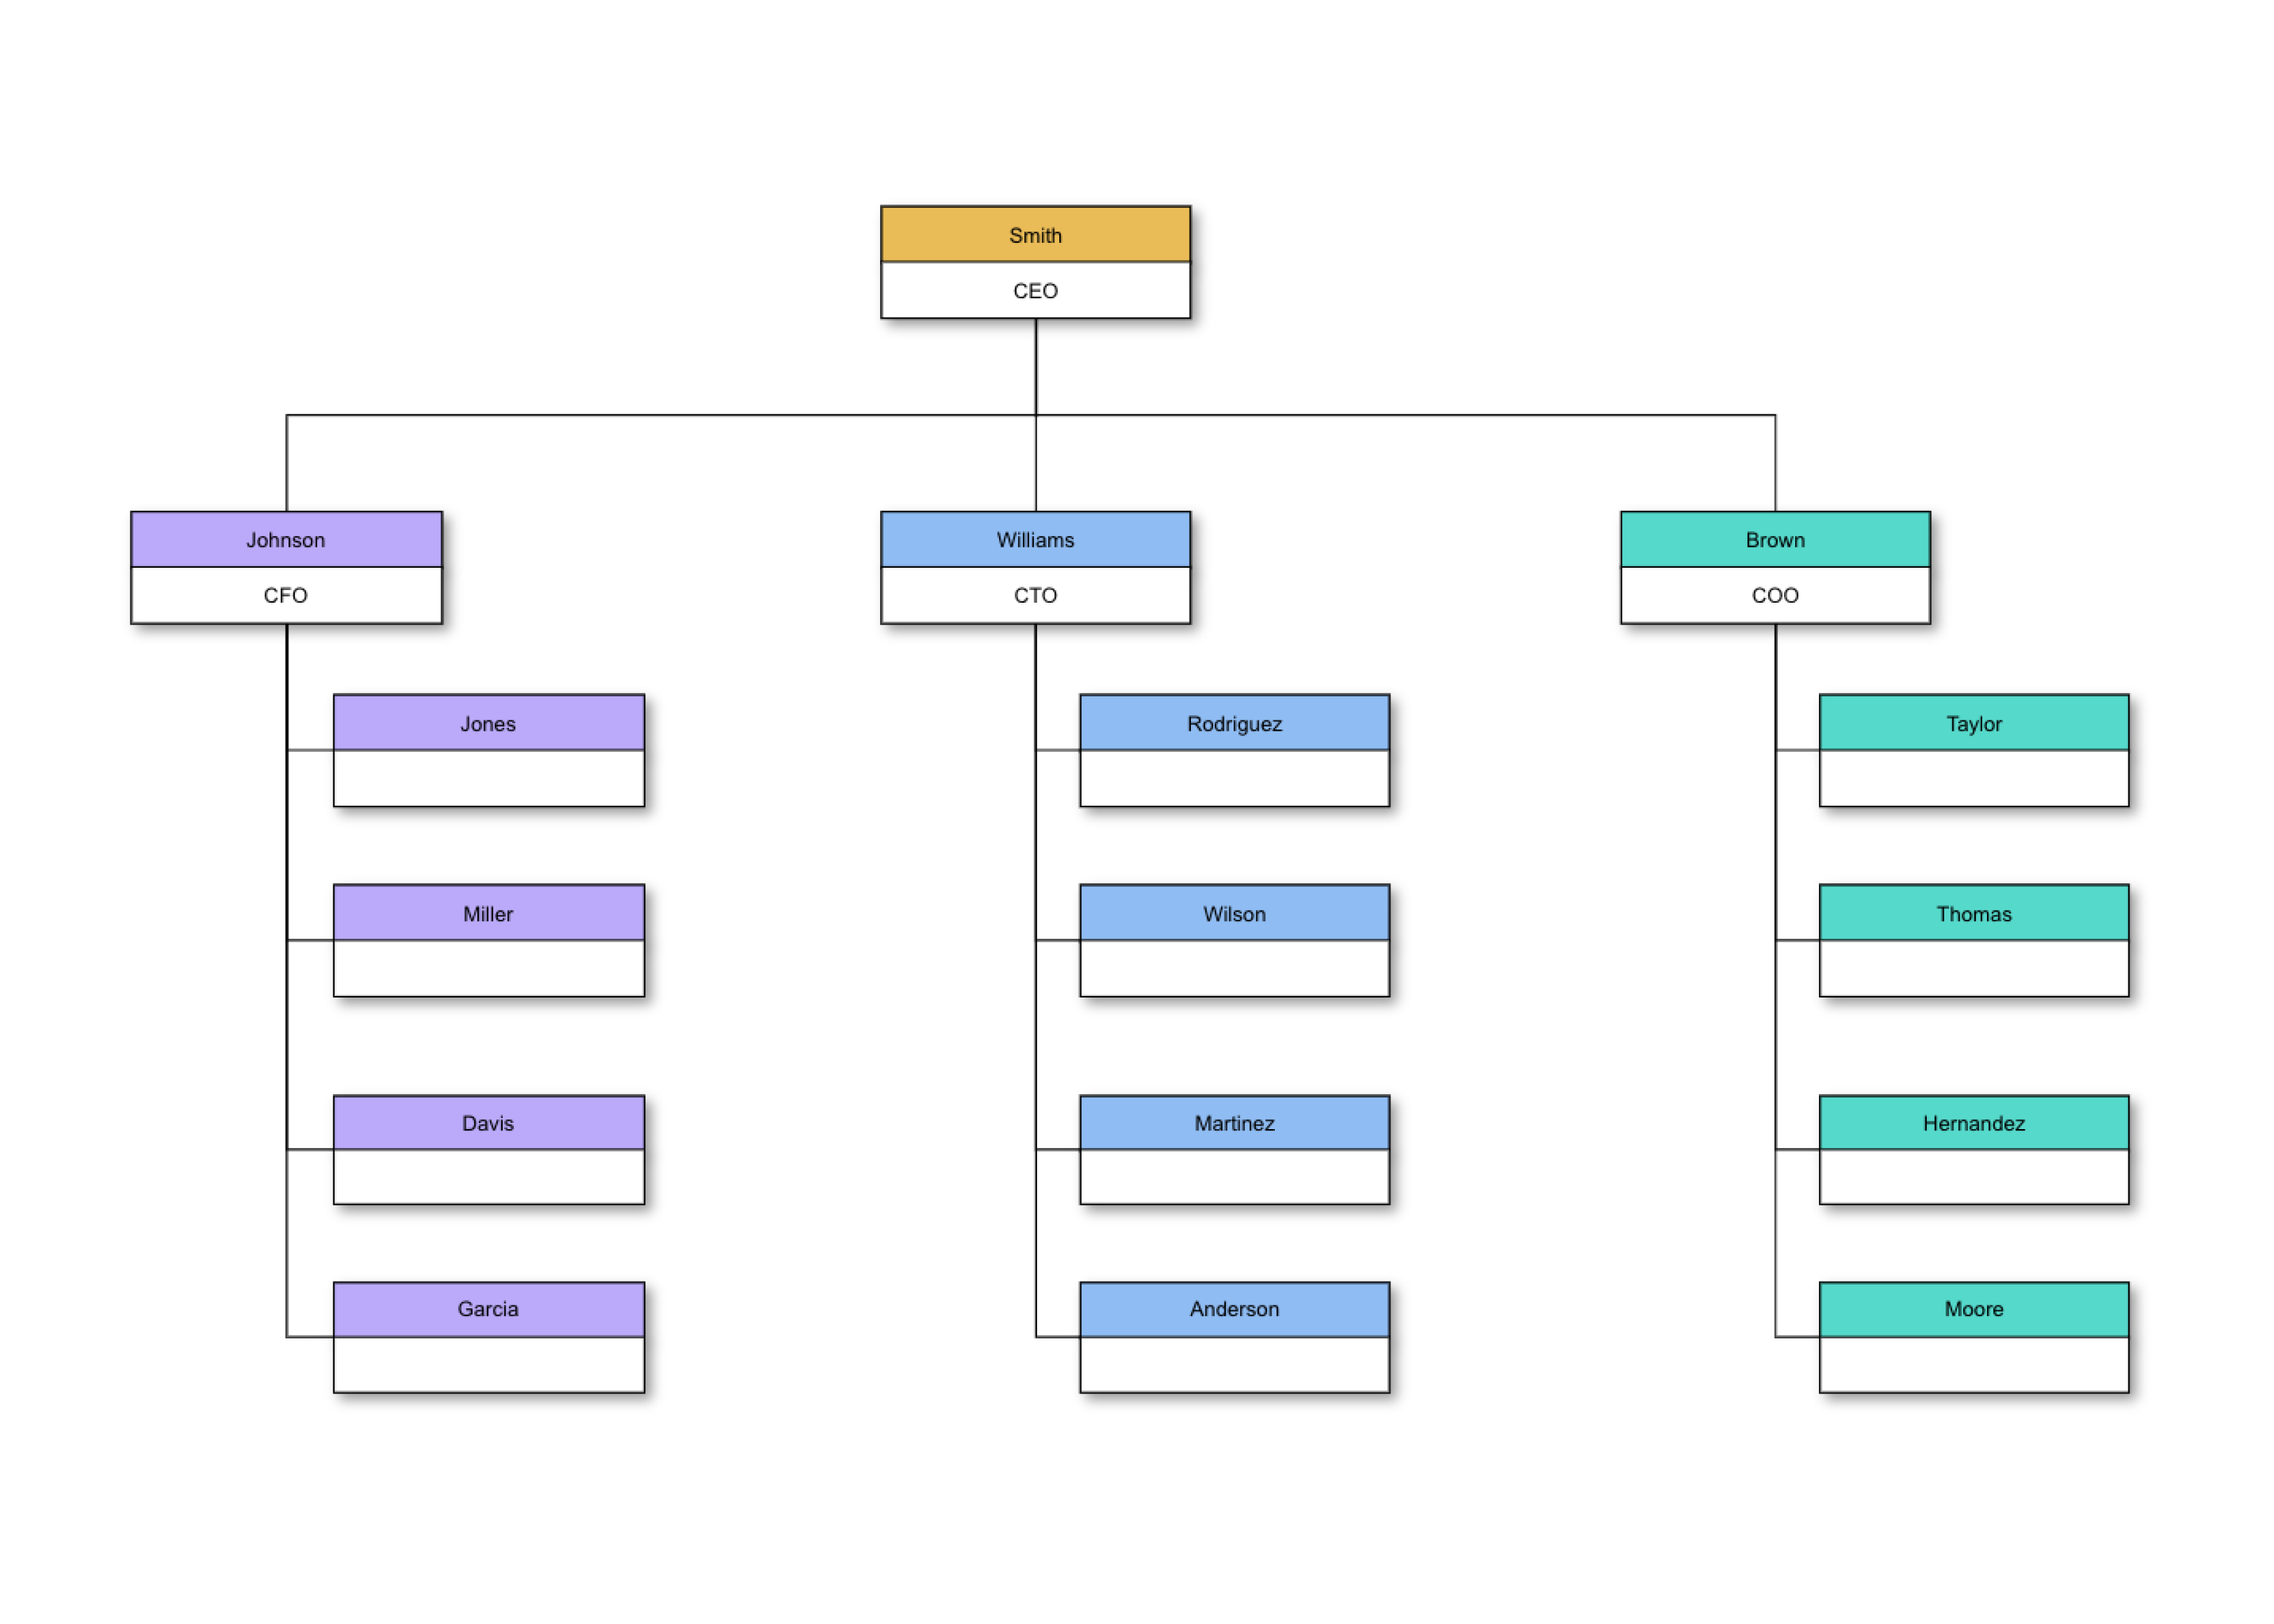
Managing a team requires keen insight into business structure and operations. Fortunately, diagrams are there to help you rein in that organization. An added benefit: diagrams are easy to update and reuse if your business structure changes.
Charting out a company’s hierarchical structure or team from the start is a huge step in streamlining an efficient workflow. Cacoo offers several business management templates to customize, depending on your organizational needs.
Mind map diagrams
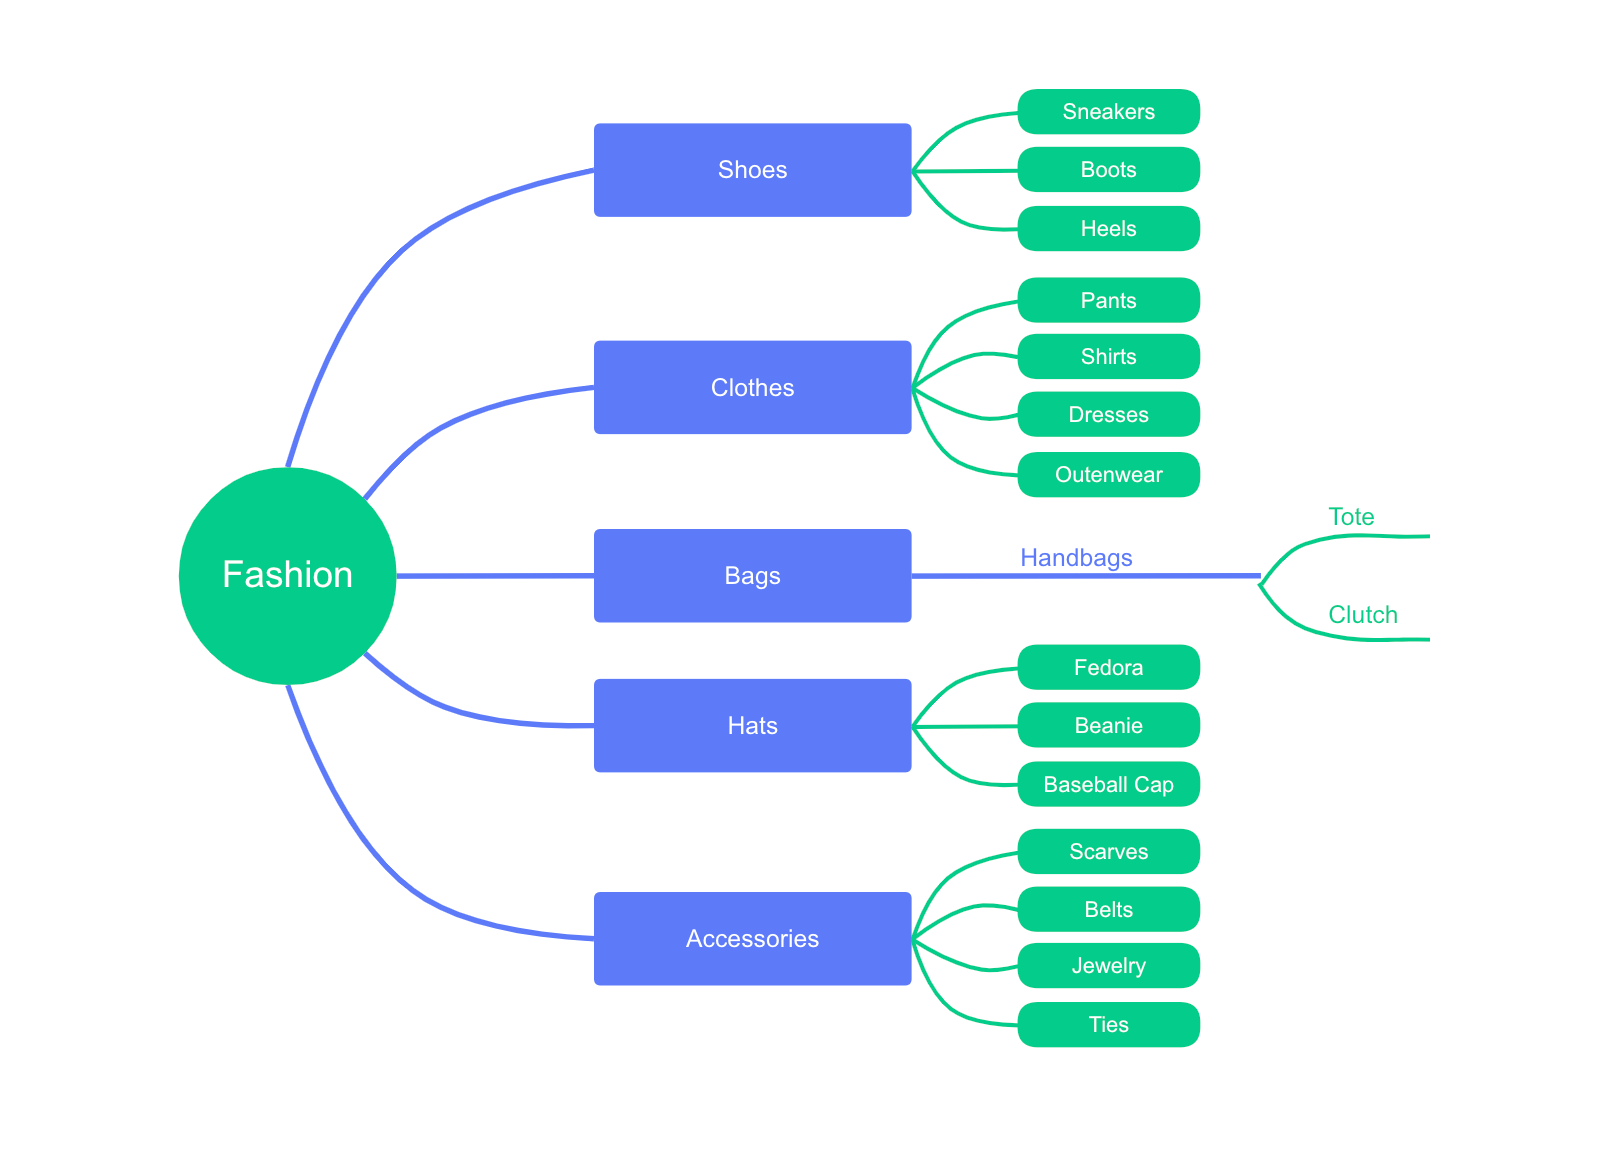
Planning meetings begin almost as soon as your team is assembled. Set yourself up for success by brainstorming and evaluating ideas early on. Mind mapping is a concise, consistent way to organize thoughts and notes. Not to mention, they’re great for collaborating in real-time.
Mind maps condense a web of ideas, which branch off the main topic. Say goodbye to pages and pages of notes, and say hello to one wonderful web.
Flow charts
Diagrams don’t just facilitate and organize communication. They’re the actual meat of the data being shared, analyzed, enhanced, prototyped, and developed. It doesn’t matter whether you’re designing apps, websites, services, narrative video games, and software or analyzing business work processes. Your end goal is to map out where every outcome, interaction, choice, and selection may lead.
Above all, you need to know your flow!
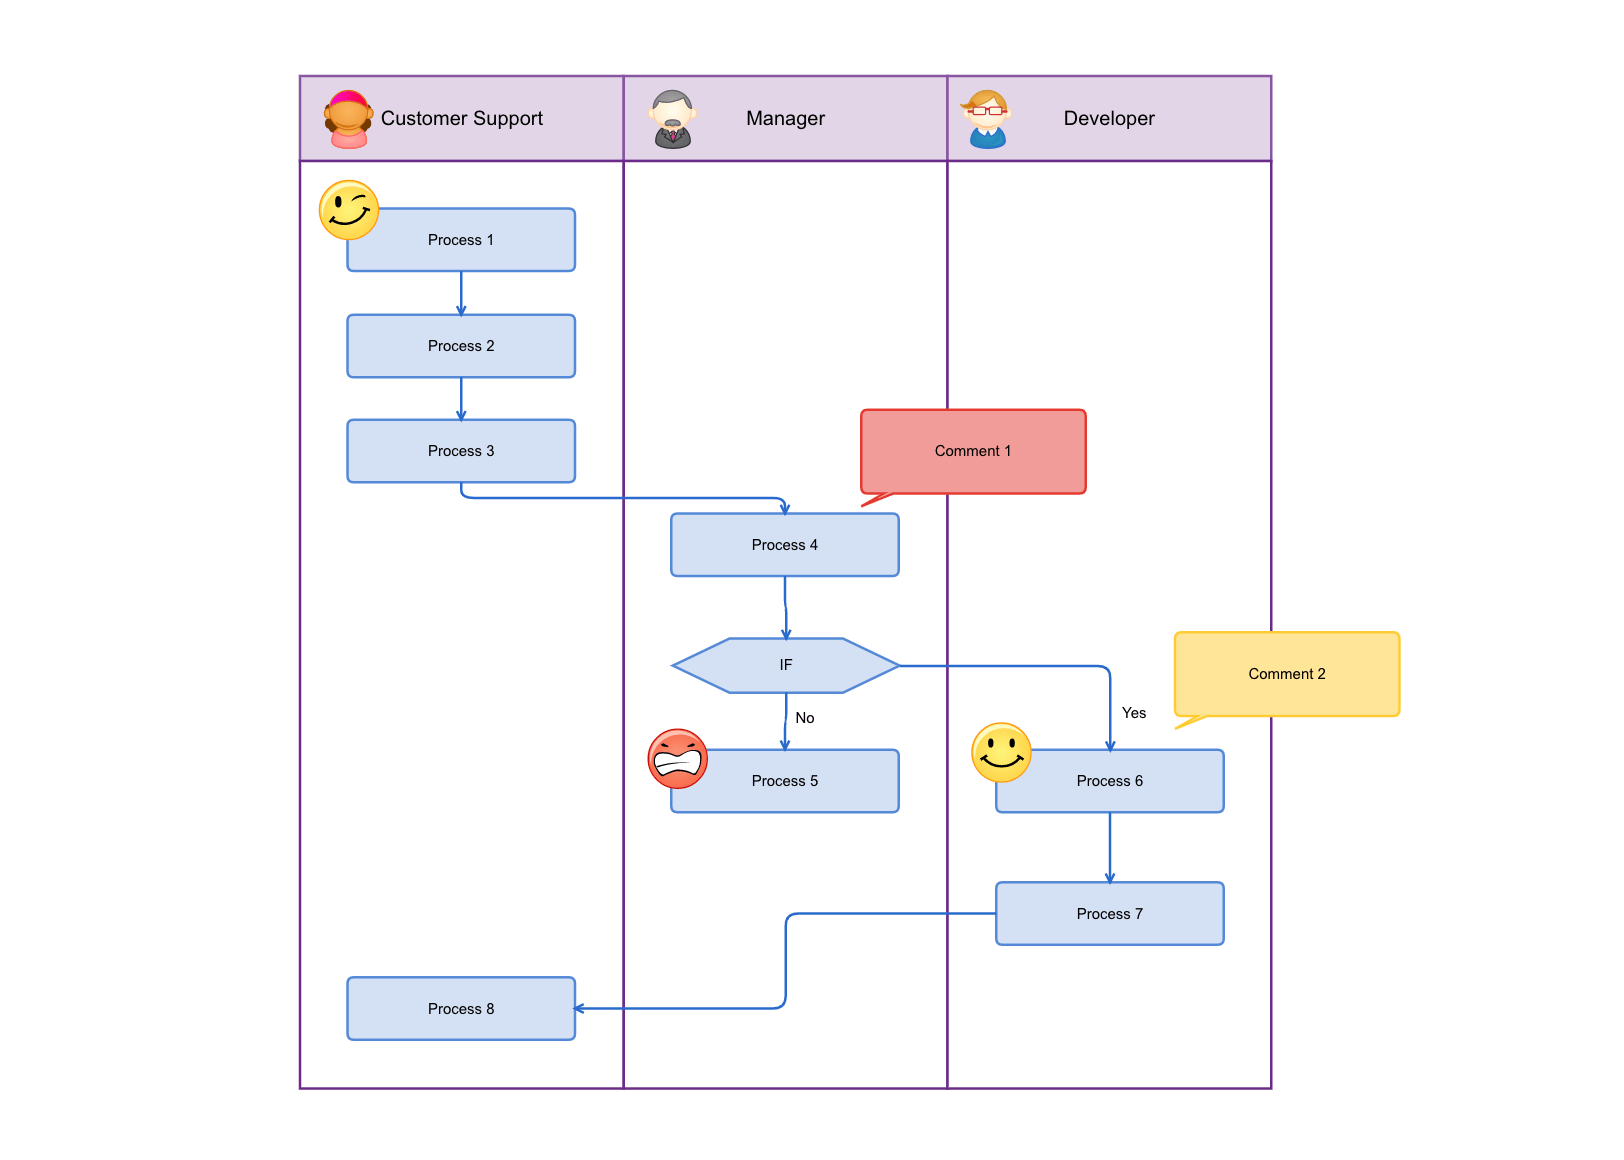
Flowcharts map out the lifeline of any product, service, or process — a rabbit hole of possible outcomes involved in troubleshooting a design. It answers the question of how a user will navigate your site, play your game, or call into your automated system.
Your flow chart is crucial in forming the user experience of your design. Let the “If this, then” mantra guide you through creating this detailed diagram.
Wireframe diagrams
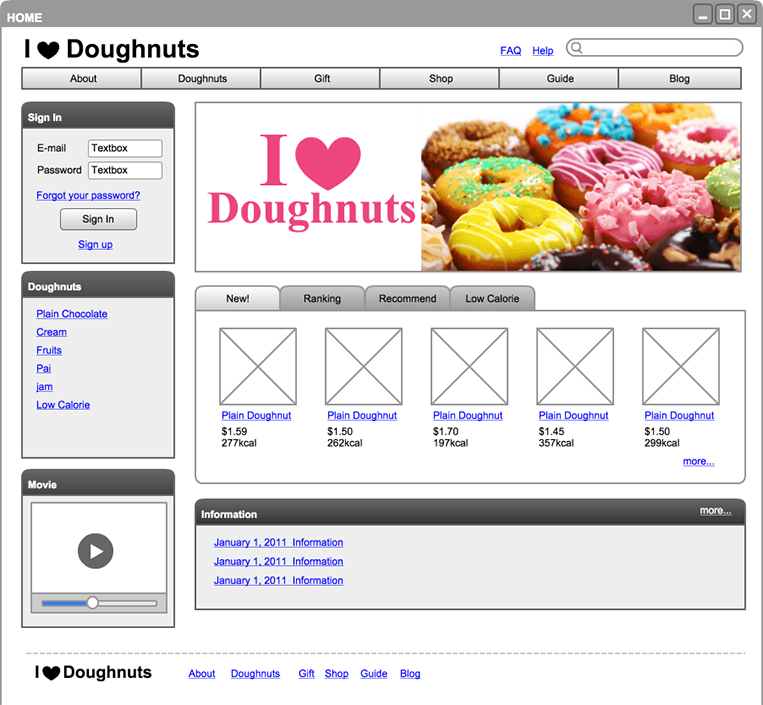
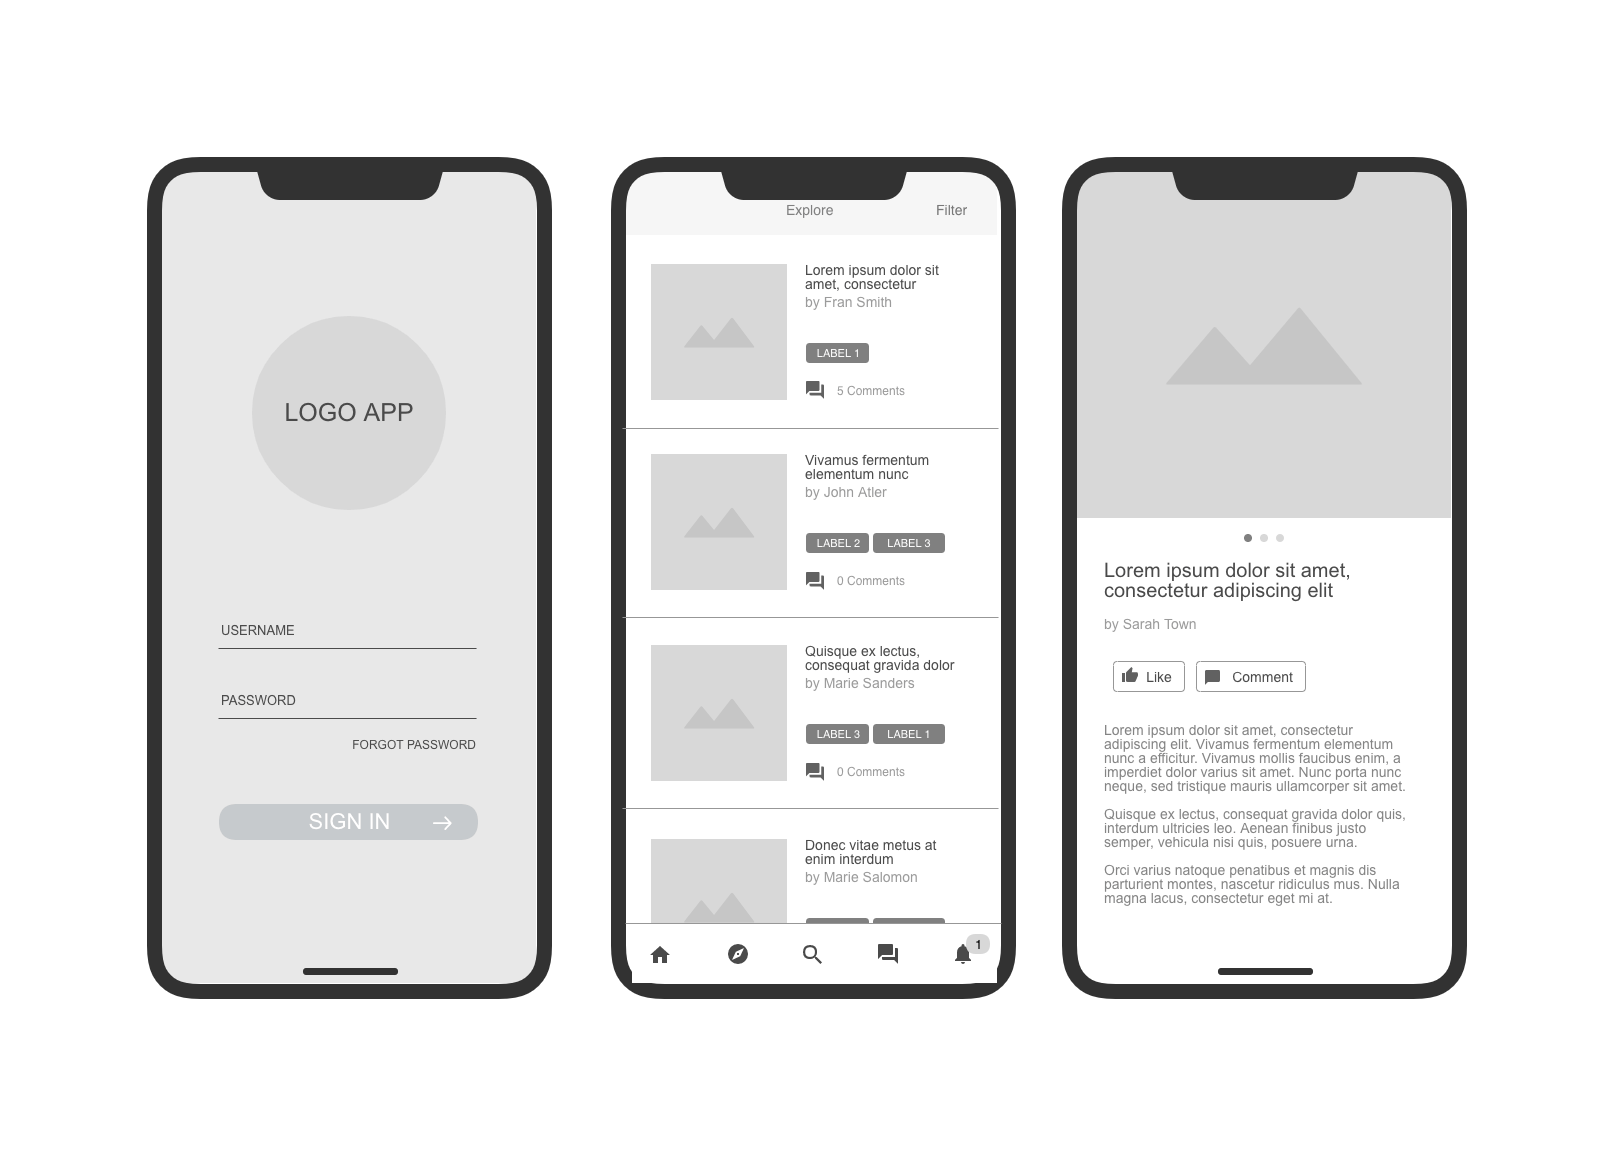
Flowcharts are often the lead-in to a wireframe diagram because they provide the basic guidelines to implement a design. Programmers, web designers, and architects use it to set the parameters of the interface they’re creating.
Imagine the skeletal layout of a building in an architectural blueprint. Likewise, wireframes offer a schematic of websites and other product designs.
A graphical mock-up serves as a workable visual when your website is unfinished or being updated. Together, the wireframe and flowchart are helpful in developing a prototype — the next step in making the product come to life.
Presentation diagrams
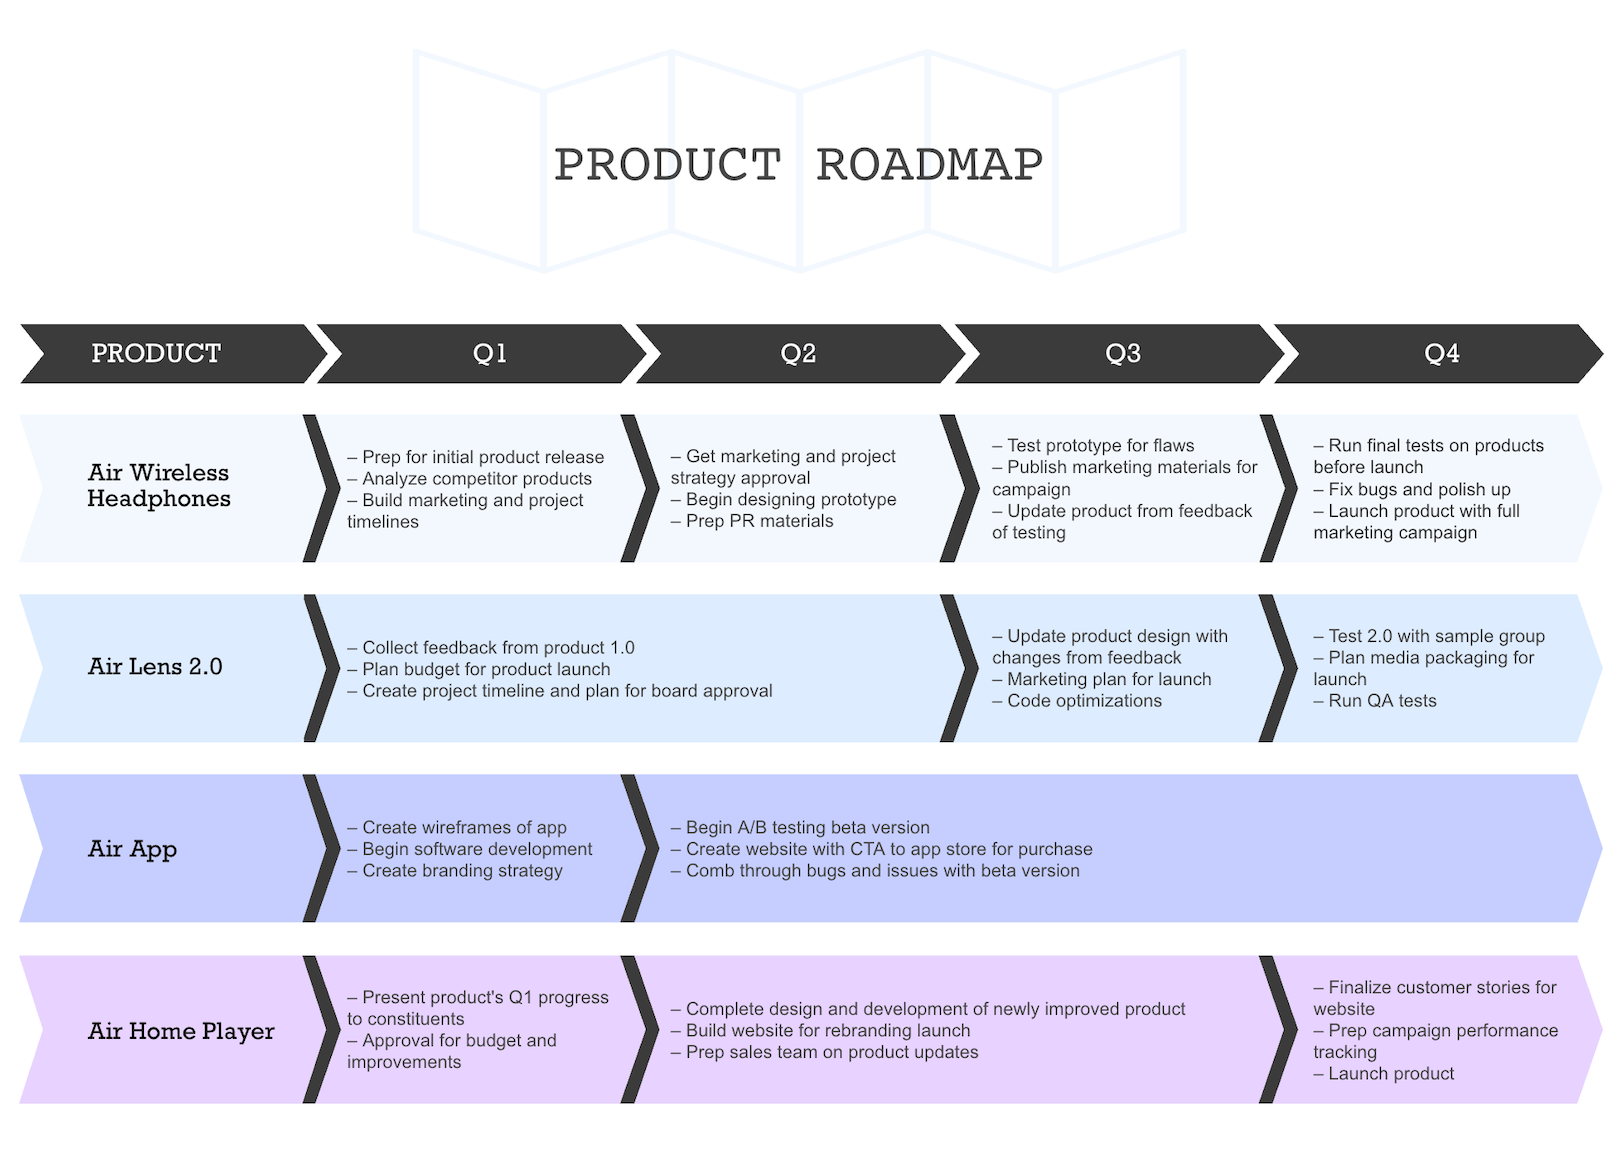
No great project should go un-presented. Diagramming tools provide the perfect climate for making presentation slides.
Create unique graphs and charts for data visualization, add images and text, and insert original diagrams to back up your findings. Visuals enhance storytelling and make your presentations more memorable, which is crucial when your goal is to influence decision-makers.
You can say that products begin and end with diagrams, and the presentation is a clear example of diagrams coming full circle.
Final thoughts
Diagramming applications aren’t limited to this list. Rather, there’s an endless supply of customizable tools to enhance communication, design, efficiency, and structure.
Learn to create diagrams that inform, excite, and surprise people. Without a doubt, your projects will be more successful!
WARNING: Diagramming is addictive. Signs of addiction include sudden organization, creative inspiration, and the need to Venn diagram every life decision. Don’t worry; you aren’t alone. You’re just in the right wireframe of mind.
This post was originally published on June 21, 2016, and updated most recently on December 10, 2021.


