Fishbone diagrams, also known as Ishikawa diagrams or cause-and-effect diagrams, are powerful tools for identifying and visualizing the potential causes of a problem or issue.
Whether you’re troubleshooting a technical glitch, improving a business process, or analyzing the root causes of a complex issue, a fishbone diagram can help you systematically organize your thoughts and uncover underlying factors contributing to the problem.
Curious about creating a fishbone diagram? At Nulab, optimizing processes to boost productivity is what we do best. That’s why we’re excited to provide a FREE fishbone diagram template in Word. After all, why spend time crafting your own when you can effortlessly edit a pre-made template?
And if you require a more comprehensive solution, we’ve got you covered. Explore Cacoo’s selection of professional-grade fishbone diagram templates, offering professional formatting choices and easy customization.
Benefits of fishbone diagrams
Before diving into the steps of creating a fishbone diagram template, let’s briefly highlight some of the benefits of using this visual tool:
Structured analysis
Fishbone diagrams provide a structured framework for organizing and categorizing potential causes of a problem, ensuring a comprehensive analysis.
Visual representation
By visually mapping out the causes and their relationships, fishbone diagrams enhance understanding and facilitate communication among team members.
Root cause identification
Fishbone diagrams help identify root causes rather than just addressing symptoms, enabling more effective problem-solving and decision-making.
Collaborative problem-solving
Fishbone diagrams encourage collaboration and participation from stakeholders, fostering a shared understanding of the problem and potential solutions.
When to use a fishbone diagram
Fishbone diagrams are versatile tools that can be applied across various industries and disciplines to analyze complex problems, improve processes, and make informed decisions. They’re particularly useful in various scenarios, including:
Problem-solving
When a team needs to identify the root causes of a problem or an issue, a fishbone diagram can help visualize the different factors contributing to it. This structured approach aids in understanding the relationships between various causes and their effects.
Quality improvement
In quality management processes like Six Sigma or Total Quality Management (TQM), fishbone diagrams are commonly used to analyze defects, errors, or inefficiencies in a process. By identifying the underlying causes, teams can implement targeted improvements to enhance quality.
Process analysis
Fishbone diagrams are valuable tools for analyzing complex processes, such as manufacturing processes, service delivery processes, or project workflows. They help identify potential bottlenecks, delays, or breakdowns in the process flow.
Risk management
When assessing risks in a project or operation, fishbone diagrams can help identify the factors contributing to potential risks or failures. This allows teams to develop mitigation strategies and contingency plans more effectively.
Product development
During the development of new products or services, fishbone diagrams aid in understanding the factors influencing product performance, customer satisfaction, or market acceptance. This helps refine product designs and features to meet customer needs better.
How to use our free fishbone diagram in Word
Step 1: Set up your document
Head to our FREE fishbone diagram template in Word to get started. Simply follow the provided link to copy the template into your Google Drive.
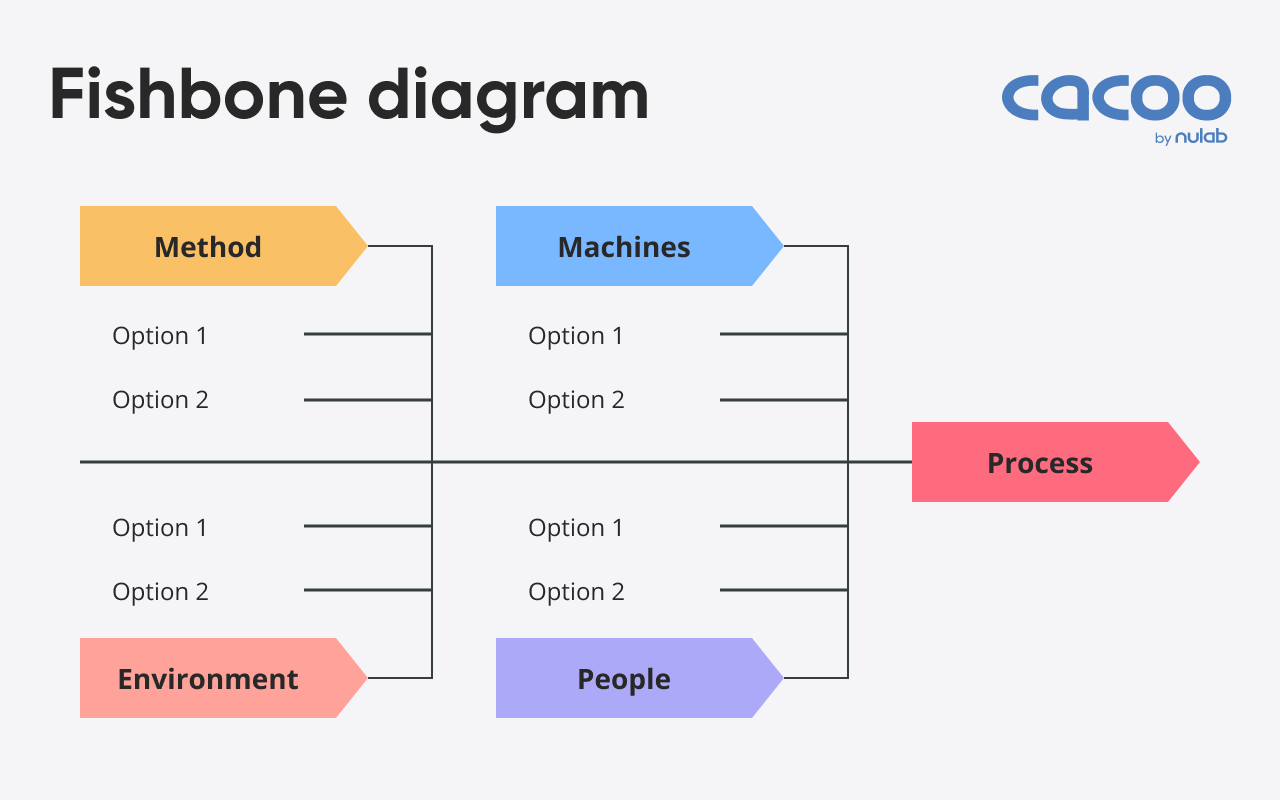
Step 2: Edit categories (fishbones)
Edit the text to represent different categories or causes related to the problem. Common categories include “people,” “process,” “equipment,” “environment,” and “management.”
Step 3: Identify subcategories and causes
For each category line, add additional lines branching off to represent subcategories or specific causes within that category. These subcategory lines should converge toward the category line they are associated with.
Step 4: Label the causes
Along each subcategory line, add labels to identify specific causes or contributing factors related to the problem. Be specific and concise in your labeling to ensure clarity and accuracy.
Step 5: Customize the diagram
Customize the fishbone diagram by adjusting the size, color, and formatting of the shapes and text elements. You can also add additional design elements or annotations to enhance clarity and visual appeal.
Step 6: Share and collaborate
Share the completed fishbone diagram with your team members or stakeholders. Encourage collaboration and discussion to gain diverse perspectives and insights.
Look to Cacoo for fishbone diagram templates
While our free fishbone diagram template in Word offers comprehensive tools, Cacoo provides additional functionalities tailored for detailed analysis:
- Collaborative editing: Cacoo fosters a collaborative space where multiple users can simultaneously work on their diagrams in real-time, eliminating delays in edits or the need for multiple document versions.
- Communication features: Integrated video chat and chat options enable seamless communication among team members during the diagramming process, facilitating discussions, brainstorming sessions, and issue resolutions.
- Comments: Users can leave comments directly on the diagrams in Cacoo, offering feedback, asking questions, or suggesting revisions, thereby enhancing collaboration and clarity.
- Revision tracking: Cacoo automatically tracks changes made to diagrams, allowing users to access and revert to previous versions as necessary, ensuring version control and accountability.
- Integration capabilities: Cacoo seamlessly integrates with various productivity tools such as Google Drive, Microsoft Office, and Slack, facilitating easy data importation and sharing of fishbone diagrams across platforms.
You can even try out one of our fishbone templates in Cacoo for free when you sign up for a 14-day free trial (no credit card required) to experience the difference specialized diagramming software can make.
About Author

Shelley
Guest authorShelley Mason is a copywriter at Nulab based in New York City.