As a project manager, you’re busy juggling multiple tasks, deadlines, and resources. But without a system to keep everything organized, it’s easy for things to get lost or delayed.
That’s why you need a project management dashboard. Whether you’re overseeing a single project or managing an entire portfolio, a good dashboard simplifies your workflow. It brings all of your project details into one place so you can quickly track progress and stay on top of priorities.
In this article, we’re taking a closer look at how to create an effective project management dashboard. But first, let’s answer some common questions you might have.
What is a project management dashboard?
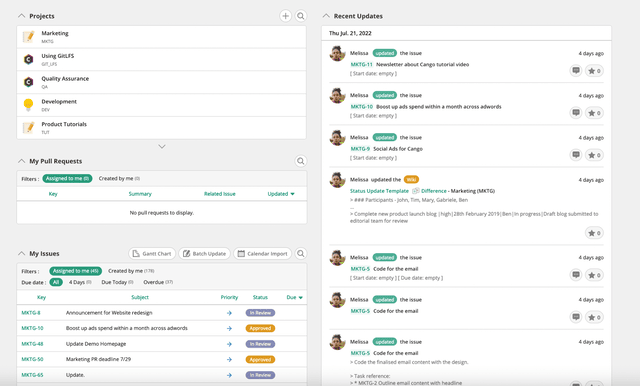
A project management dashboard is a visual tool that consolidates project information into one centralized space. It provides real-time data on project progress, key performance indicators (KPIs), and potential issues. Think of it as a command center for your project.
With this overview, you’ll see what’s working, what needs attention, and how your team’s efforts align with project goals.
Benefits of project management dashboards
There are unlimited benefits to using project management dashboards.
For instance, they:
- Improve team communication and foster better decisions by giving everyone access to the same data. (No silos!)
- Promote transparency by providing stakeholders with a clear overview of progress and challenges.
- Support better resource allocation so your team focuses on the right priorities.
- Simplify reporting by consolidating key metrics into an easy-to-share format.
- Enhance visibility into project status so you can spot potential risks early.
- Centralize critical information, reducing time spent searching for updates.
- Increase accountability by clearly assigning tasks and tracking progress.
- Support more accurate forecasting with real-time data insights.
- Save time by cutting through cluttered spreadsheets and emails.
- Keep complex projects running smoothly from start to finish.
Common challenges with project management dashboards
Even with the best tools, creating an effective project management dashboard comes with challenges.
Some common issues include:
- Limited user training. Teams unfamiliar with the dashboard may not use it effectively. Be sure to provide training so your team understands how to interpret and interact with your project data. (More on this in a bit.)
- Lack of real-time updates. Outdated data leads to inaccurate insights. Make sure your dashboard integrates with tools that provide live updates.
- Poor design. A cluttered or confusing layout makes the dashboard less effective. Use clear labels, intuitive navigation, and logical groupings.
- Data overload. Too much information can overwhelm users. Keep the dashboard focused on the most critical metrics.
Test your dashboard regularly and refine it based on feedback so it supports your team’s unique needs.
Why use a project management dashboard?
A project management dashboard gives you a high-level overview of your project. It simplifies planning and execution by organizing key project metrics like timelines, milestones, and budgets.
It also helps you identify potential risks before they escalate. This gives you peace of mind that you simply can’t get from a notebook on your desk or a complicated spreadsheet.
Dashboards also enhance and promote team collaboration. For example, if you’re building a dashboard for solar project management, you might include real-time updates on task completion, GPS coordinates for panel placement, and a shared calendar for inspection and installation dates. Team members can comment on tasks, share documents, and update the status of materials and equipment in real time.
This keeps everyone informed and aligned as the project progresses.
What makes an effective project management dashboard?
Great dashboards don’t have a bunch of crammed data on a single screen. They display the right information in a clear, actionable way. For example, if you’re tracking financial health, your dashboard might include actual costs versus budget, overdue tasks, and projected expenses. Here are the key elements of an effective project management dashboard.
Customizable views
Tailor the layout to highlight the metrics that matter most to your project. Use visualization tools like graphs and charts for better clarity.
Real-time data
Display the latest updates so you’re always working with accurate information.
Key metrics
Focus on task progress, financial health, project risks, and task status to gauge overall project health.
Intuitive design
A cluttered dashboard overwhelms users. Keep it simple, clean, and easy to navigate.
Team collaboration tools
Integrate features like file sharing and comments to streamline communication and encourage efficient teamwork.
Automation capabilities
Automate data updates and reminders to save time and reduce manual work.
Role-based permissions
Control access to sensitive information by assigning user roles.
Integration options
Connect with other tools like CRMs, time trackers, or financial platforms for seamless workflows.
Scalability
Design the dashboard to grow with your projects so you can accommodate more data and users over time.
Alerts and notifications
Set up alerts for overdue tasks, budget overages, or approaching deadlines.
Historical data
Include trends or comparisons to evaluate past project performance.
8 steps to build a custom project management dashboard
Now that we’ve laid the foundation let’s walk through how to build your project dashboard. The specifics of building a dashboard depend on your project management software. Tools like Backlog, Trello, and Asana offer unique layouts and features.
In this section, we’ll run through how to set up a project management dashboard using a project management tool. Then, we’ll show you how to do it in Backlog using our handy checklist!
Here are some general steps to follow regardless of what tool you pick:
1. Define your project goals and metrics
Start with a clear understanding of what you want to achieve.
Ask yourself: What do I need to track? Examples might include task progress, project milestones, or project risks. Defining your goals will help you focus your dashboard on the right data.
2. Choose the right visualization tools
Select graphs, charts, or tables that make the data easy to understand. For example, a Gantt chart can show project phase timelines, while bar graphs are great for highlighting task completion rates.
3. Organize your dashboard layout
Structure your dashboard to present the most important information first. Place urgent metrics like deadlines, budget updates, and overdue tasks at the top.
Use collapsible sections or tabs for secondary data like upcoming projects or personalized project views.
If you’re building a tech product, make sure to include security on your project dashboard.
Integrating continuous threat exposure management into the dashboard lets you track security progress alongside project metrics. With this extra visibility, you can make better decisions about timelines, resources, and potential risks.
For example, if security issues are holding things up, you can adjust the timeline or shift resources to handle them without derailing the project.
To integrate continuous threat exposure management (CTEM) into a project dashboard:
- Collect security data from tools like vulnerability scanners and threat intelligence feeds.
- Define key metrics like unresolved vulnerabilities, remediation time, and risk levels.
- Integrate with project tools to pull security data into your dashboard.
- Visualize security info with charts or progress bars.
- Prioritize critical risks and set alerts for emerging threats or deadlines.
- Monitor the impact of security tasks on project timelines and resources in real time.
4. Automate data integration
Connect your dashboard to other software for real-time updates. For example, if you’re creating a customer satisfaction project dashboard, you can pull in data from Dynamics 365 Business Central to centralize customer information. This helps you track sentiment, retention, and key metrics in real time.
You could also integrate data from surveys and market research to measure retention rates, repeat business, and customer recommendations.
5. Customize for team relevance
Make sure your dashboard is useful for all stakeholders. For example, managers might need high-level summaries. And team members might require task-specific details — like writing code or sending drafts to a managing editor for review. Use customizable views to cater to these different needs.
6. Test functionality and usability
Run a pilot with your team to identify gaps or inefficiencies. Does the layout make sense? Are the metrics accurate?
Use feedback to fine-tune the dashboard to support your team’s needs.
7. Document processes and train your team
Create guides or quick tutorials to help your team navigate and use the dashboard effectively. Highlight features like real-time updates, collaboration tools, and key metrics.
Make sure everyone knows how to access project status dashboards, interpret visuals, and collaborate efficiently.
For instance, create a Loom video and add it to your project discussion channel in Slack. Or create a Notion site that breaks down how the dashboard works and email a link to it to your project team.
You could also jump on a video call to go through the dashboard if it’s really intricate and you have the time!
8. Regularly update and optimize
Dashboards are living tools. As your project changes, your dashboard should too. Keep it fresh by reviewing and updating it regularly. Add new tools, tweak KPIs, and make sure the dashboard remains aligned with your evolving priorities.
Benefits of using Backlog to create your dashboard
We offer a suite of tools designed to simplify project management, making it an excellent choice for creating dashboards.
- Seamless integrations: Connect Backlog with time trackers, communication apps, and other tools your team uses daily to keep data synchronized.
- Ease of use: Nulab’s intuitive interface makes it easy for teams to create and customize dashboards without extensive training.
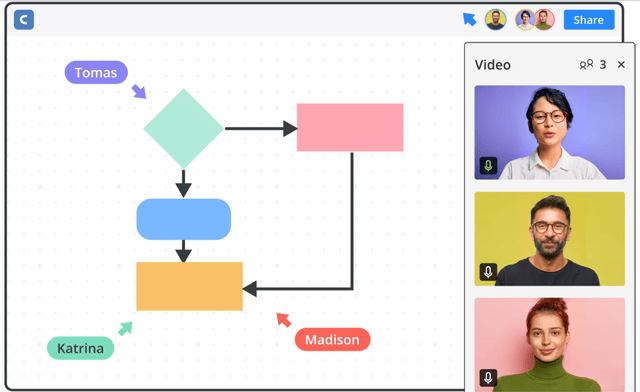
- Real-time collaboration: With features like comments, file sharing, and notifications, your team stays aligned and engaged.
- Template creation: Save dashboard templates to maintain consistency across projects and streamline future setups.
- Practical visualization tools: Create dynamic graphs, charts, and tables to visualize project metrics effectively.
Using Nulab gives you a platform that boosts productivity, unites your team, and provides clarity in your projects. Follow our checklist in the next section to get started with Nulab.
How to build a project management dashboard in Backlog
Follow this checklist to create a custom project management dashboard template using Backlog:
- Step 1: Log into Backlog and create a new project. Assign a name and description that reflects your project’s goals.
- Step 2: Enable all “Attributes and functionality” to activate subtasking.
- Step 3: Set up categories for the different types of work your team will handle.
- Step 4: Add Milestones to track progress. (Like “Beta release,” “Internal release,” and “Launch.”)
- Step 5: Create tasks for each aspect of the project. Use parent issues for major goals and break them into child issues to outline specific tasks. For each task, include the:
- Assignee
- Start and due date
- Milestone
- Priority
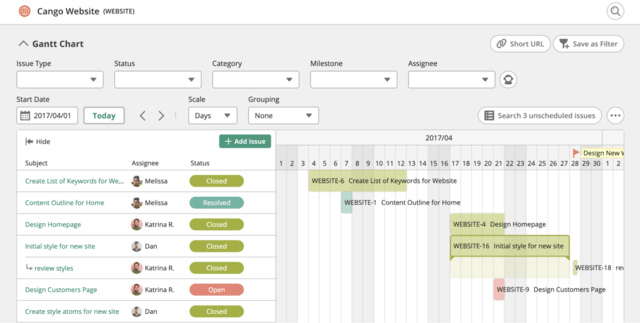
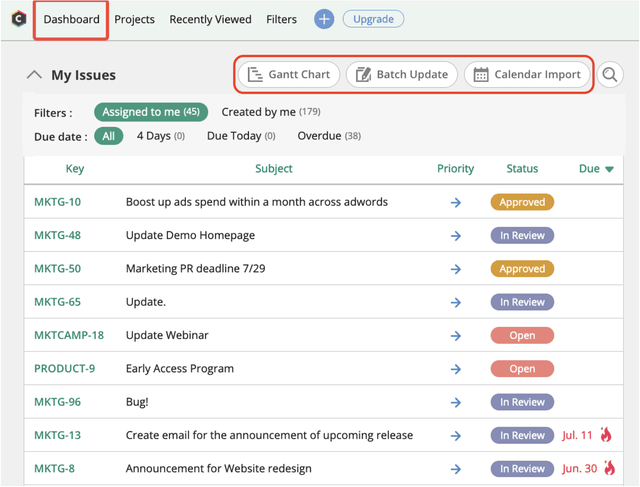
- Step 6: View your plan visually through the Gantt Chart to monitor progress by milestone.
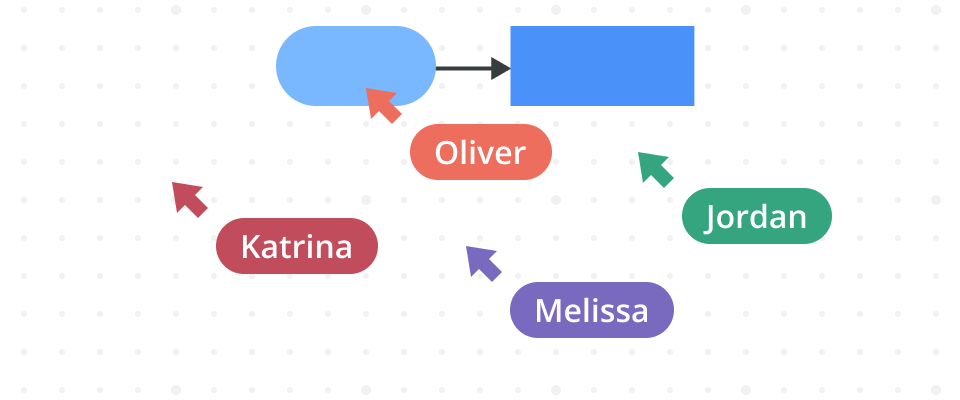
- Step 7: Collaborate efficiently by using @mentions to gather feedback, notify others when tasks are complete, and make sure dependent tasks can start without delay.
- Step 8: Integrate real-time data sources. Sync Backlog with tools your team already uses, such as time trackers or communication apps.
- Step 9: Save your dashboard template. Use it as a base for future projects.
And in case you’re still on the fence about dashboards…
Why dashboards are better than traditional tracking methods
Traditional project tracking methods like spreadsheets and email chains are time-consuming and prone to error. Dashboards provide a superior alternative with centralized information.
They consolidate all project data in one place, so your team doesn’t need to juggle multiple documents. Unlike static spreadsheets, dashboards offer live updates, so your project group always works with the latest information.
Plus, your team members can comment, share files, and track progress collaboratively without needing multiple communication channels.
Many dashboards also automatically sync with other tools, so you don’t have to worry about keeping up with manual updates.
Final thoughts
Building an effective project management dashboard takes planning, but the benefits are worth it. A well-designed dashboard offers clarity, fosters team communication, and guides projects to stay on track.
The key to success is tailoring the dashboard to your project’s needs. Whether you’re managing task completion rates or tracking actual costs versus budget, focus on customization and data that drives results. Ready to streamline your projects? Try a project management tool today.
Author bio

Ryan Robinson is a blogger, podcaster, and (recovering) side project addict who teaches 500,000 monthly readers how to start a blog and grow a profitable side business at ryrob.com.
About Author