As a project manager, one of your most important jobs is managing expectations. Your team needs realistic goals. Your client wants clear answers. And you’re the bridge between the two. But how you define and communicate timelines can look drastically different depending on the methodology you use — specifically, Agile or Waterfall.
Luckily, Backlog gives you flexible tools that support both approaches. It’s easy to use, and even easier for your clients to understand. From Gantt charts to burndown charts, here’s how to plan, track, and communicate work in a way that makes sense.
In this guide, we’ll cover:
- How to use Backlog to manage Agile and Waterfall workflows
- How to translate technical progress into helpful client updates
- When to use story points vs. absolute time estimates
- Hybrid methods and best practices inside Backlog.
Understanding Agile vs. Waterfall
Here’s a lightning-fast refresher:
- Waterfall: As its name suggests, this is a sequential, linear approach — just like water tumbling down a cliff! Once you’ve finished one phase, you move on to the next, with no back-and-forth. Use it for projects with fixed requirements and predictable timelines, like launching a product with a fixed release date.
- Agile: This developer favourite is iterative in nature. Teams break their work into chunks called Sprints. After each round (usually lasting two weeks), they get feedback and tweak things as needed. It’s great for projects with shifting requirements.
Waterfall: Use Gantt charts for clarity
In Backlog, Gantt charts offer a bird’s-eye view of the entire project timeline. Colorful blocks represent start and end dates, which are plotted along a continuous timeline. These charts also show dependencies using subtasking, which is ideal for Waterfall projects where timing and order matter.
You can use Gantt charts in Backlog to:
- Plan the entire project before starting work
- Set clear expectations with clients on deadlines and delivery
- Show task dependencies and adjust them easily when timelines shift
- Track task progress as your team marks them complete.
How to set up Waterfall tracking in Backlog
- Create a new project in Backlog.
- Add milestones for major phases of your project.
- Add issues (tasks) to each milestone with:
- Start and due dates
- Assigned team members
- Task descriptions
- Head to the Gantt chart view to see all tasks arranged in a timeline.
- Adjust task dependencies by dragging and linking them together.
- Share the chart with clients or stakeholders via a link or export. Or, if they want real-time insight, add them to the project as a ‘Guest’, so they can log in and see progress (but not change or delete things).
Why Gantt charts work for Waterfall
- Predictable timelines: Since the scope is known and changes are minimal, the fixed schedule in a Gantt chart makes it easy to commit to client deadlines.
- Clear dependencies: Backlog lets you link tasks to show what must be finished before the next begins.
- Easy to communicate: Clients unfamiliar with Waterfall will find Gantt charts intuitive. You can export visuals or present progress in meetings without needing to explain story points or Sprint velocity.
How Gantt charts help clients
For Waterfall projects, Gantt charts are the perfect tool to show:
- How long will each phase take
- What needs to happen before the next step can begin (dependencies)
- Where you are in the project timeline
Clients appreciate the clarity. Just make sure you update task statuses regularly to reflect reality. Clients also appreciate when you flag risks early — like a delay in the design phase affecting the rest of the schedule.
Agile projects in Backlog: burndown charts and story points
Agile methodologies (including Scrum and Kanban) work best in flexible environments. And with priorities that change as quickly as the weather, good client communication is all the more important.
Burndown charts help you track progress during Sprints and adapt quickly to change, making them a better fit vs. Waterfall.
If work progress is not progressing as estimated, a flame icon will show on the chart.
Why burndown charts suit Agile
In Backlog, burndown charts clearly display how much work remains versus the time left in the milestone in real time. As the team completes each task, the chart “burns down” toward zero. This helps teams and clients quickly understand whether work is on track — even if individual task durations shift.
Agile teams can use burndown charts to:
- Track Sprint progress in real-time
- Visualize workload and velocity
- Spot scope creep or delays early
- Adjust expectations without reworking the entire plan.
Using story points and relative estimates
Burndown charts show how much time the team needs to complete a task. There are two modes of estimation to help PMs work this out.
- Absolute estimation: This is a direct estimation of the work/time needed for a task, e.g. in units of hours, man-days, or man-months.
- Relative estimation: An estimation of time per task, reached by comparing it with another task. This relative measure of complexity, time, and effort is called a story point.
Different team members often disagree on exact time estimates, like whether a task takes 5 or 8 days. These debates waste time and slow down planning.
With relative estimates, expressed via story points, it’s easier to agree that Task A and Task B are similar in size, so they likely take about the same time. This speeds up decision-making.
It’s also easier to adjust plans later. If Task A ends up taking 8 days instead of 5, you can simply apply that new timing to other one-point tasks like Task B. You avoid the hassle of updating each task’s estimate manually — just multiply the total story points by the new average to check if you’ll still meet the deadline.
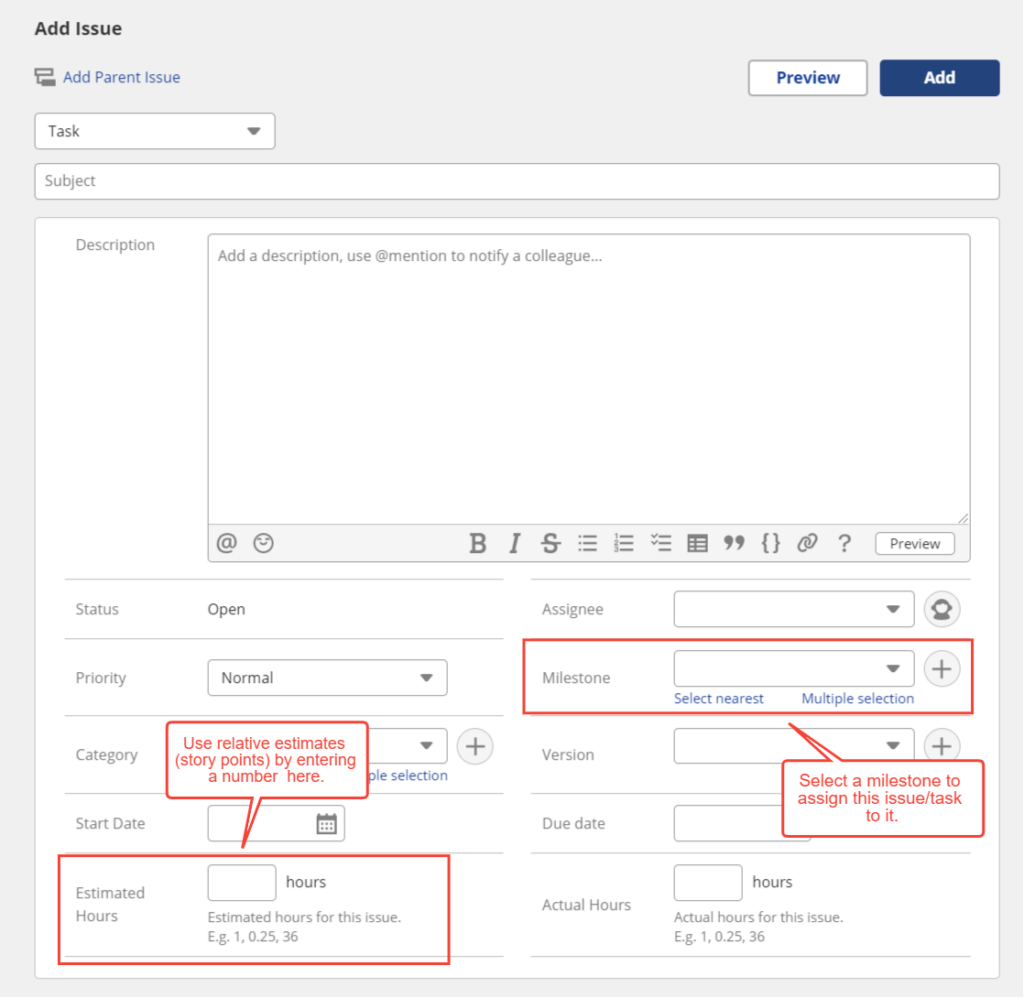
Backlog allows you to use story points instead of absolute time estimates by:
- Creating issues and assigning relative effort values (e.g. 1, 3, 5). In Backlog, this is usually done through the Estimated Hours field, which many teams repurpose to represent story points.
- Using these values in burndown charts to track progress.
- Recalculating remaining time based on team velocity.
This method is ideal when the actual time to complete a task is uncertain or varies based on who’s doing it.
How to manage Agile workflows in Backlog
- Set up milestones as Sprints or iterations.
- Add issues to each milestone and assign story points.
- Encourage your team to update task statuses frequently.
- Head to the burndown chart to track progress in real time.
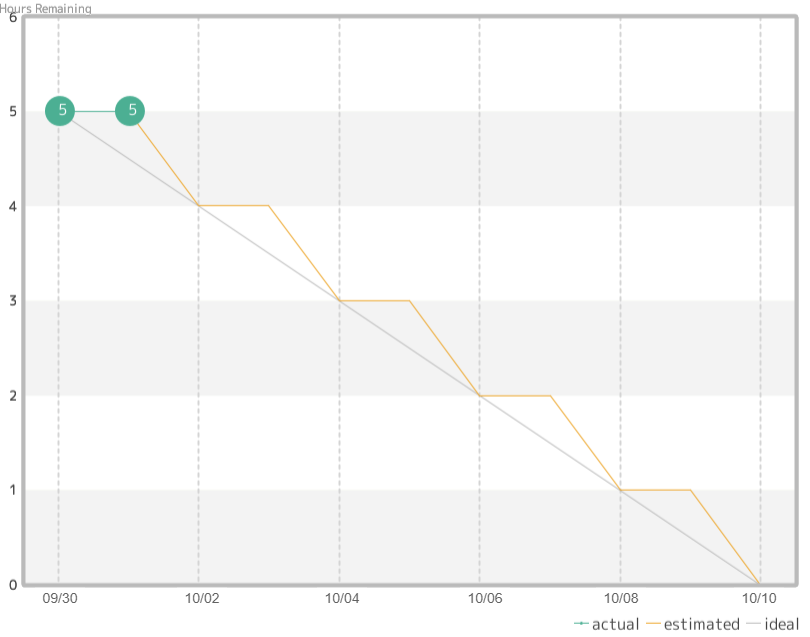
An example burndown chart created in Backlog.
- If tasks are taking longer than expected, adjust the remaining workload or extend the milestone.
When tasks take longer than expected, teams typically adjust by extending deadlines or narrowing the Sprint scope.
With relative estimates, you don’t need to update each task’s time — just adjust your overall expectations. But with absolute estimates, you’d have to revise every time-based value manually.
That’s why relative estimates handle change more easily — another key advantage!
How burndown charts help clients
Clients following an Agile project want to know: Are we making progress? Will we deliver on time? Both reasonable questions, but tricky to stay on top of progress when things move fast.
Use the burndown chart in Backlog to:
- Show Sprint progress visually and in real time (if you give them Guest access, which we recommend)
- Set expectations early if things fall behind
- Back up discussions about scope changes with data
- Highlight team velocity trends over time.
Pro tip: Backlog’s burndown charts update automatically every five minutes — no need to manually calculate anything.
Choosing the right method in Backlog: cheat sheet
Here’s a table to help you make the right choice for your next project.
| Feature | Waterfall (Gantt) | Agile (burndown + story points) |
| Planning style | Upfront, linear | Iterative, flexible |
| Best for | Fixed-scope projects, predictable timelines | Evolving projects, flexible scopes |
| Time estimates | Absolute (hours/days) | Relative (story points) |
| Timeline visibility | Clear start/end dates per task | Ongoing tracking based on team velocity |
| Client communication | Precise timelines and dependencies | Progress updates, early scope discussions |
| Backlog tools to use | Gantt charts, milestones, due dates | Burndown charts, story points, milestones |
Hybrid approaches: When to mix Agile and Waterfall in Backlog
In real-world projects, you might use both methods. E.g.:
- Use Gantt charts when you want to show the overall roadmap plus key milestones.
- Use burndown charts for Sprint-by-Sprint tracking within those milestones.
This hybrid approach works especially well when:
- You need to give clients a long-term view (via Gantt).
- You want the team to work iteratively (via Agile Sprints).
With Backlog, you can easily toggle between both views. This means you get the best of both worlds: big-picture timelines with Gantt and day-to-day progress tracking with burndown charts — without duplicating effort. And depending on how involved your client wants to be, you can give them access to the Gantt chart alone (easier for them to understand) or add burndown access for those who want more granular detail.
Tips for managing Agile and Waterfall in Backlog
Whether you’re fully Agile, Waterfall, or somewhere in between, Backlog offers features to support smooth communication and collaboration:
Use milestones strategically
- For Agile: Treat milestones as Sprints or release goals.
- For Waterfall: Use them to track each project phase.
Add custom fields to issues
Need to track both story points and estimated hours? Backlog supports custom fields so you can have the best of both worlds.
Use task templates
No need to reinvent the wheel! Speed up issue creation for recurring Agile or Waterfall tasks with task templates.
Label and categorize your tasks
Use labels to differentiate tasks by Sprint, priority, or type of work — especially helpful when working in hybrid models.
Involve the team
In Agile projects, define your story point baseline with your team before the first Sprint. This helps you make more accurate forecasts while helping the team feel in control of their own pace.
Use Waterfall to manage risk
Waterfall planning, and specifically Gantt charts, are great for setting out task dependencies and forecasting bottlenecks. Use it to plan ahead.
Keep your diagrams and visuals close
For PMs presenting timelines, complement your Gantt or burndown charts with Cacoo diagrams. You can use them to:
- Illustrate project roadmaps
- Present progress in meetings
- Map dependencies or systems.
Backlog integrates with Cacoo, making it easy to switch between diagramming and tracking without losing context.
Backlog helps you connect with your clients
Clients want clarity, consistency, and confidence. Whether you use Waterfall or Agile, Backlog gives you the tools to:
- Plan with precision using Gantt charts
- Adapt and iterate with burndown charts and story points
- Communicate clearly with visuals and real-time data
- Keep stakeholders informed with milestone tracking
By choosing the right method for your project and applying Backlog’s built-in features wisely, you’ll improve transparency and build stronger relationships with your clients.
Log in to Backlog and try both Gantt and burndown views to see which suits your project best. Agile or Waterfall — you’re covered either way!
About Author

Georgina Guthrie
Guest authorGeorgina is a displaced Brit currently working in France as a freelance copywriter. Before moving to sunnier climates, she worked as a B2B agency writer in Bristol, England, which is also where she was born. In her spare time, she enjoys old films and cooking (badly).