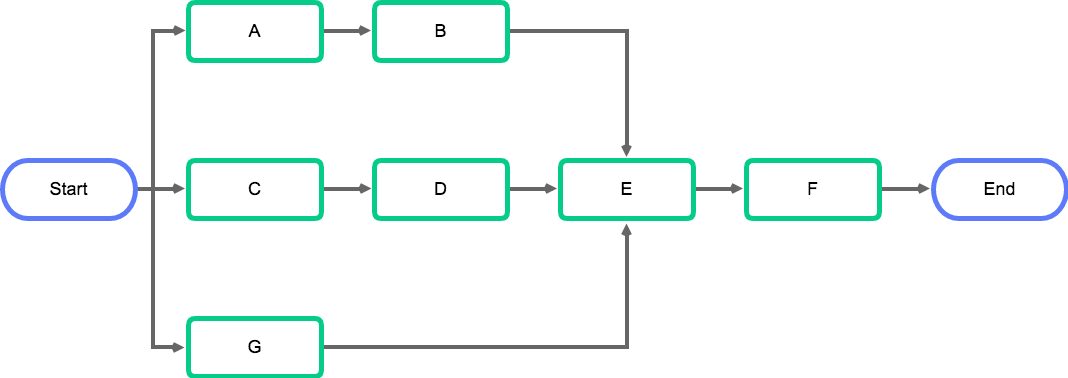
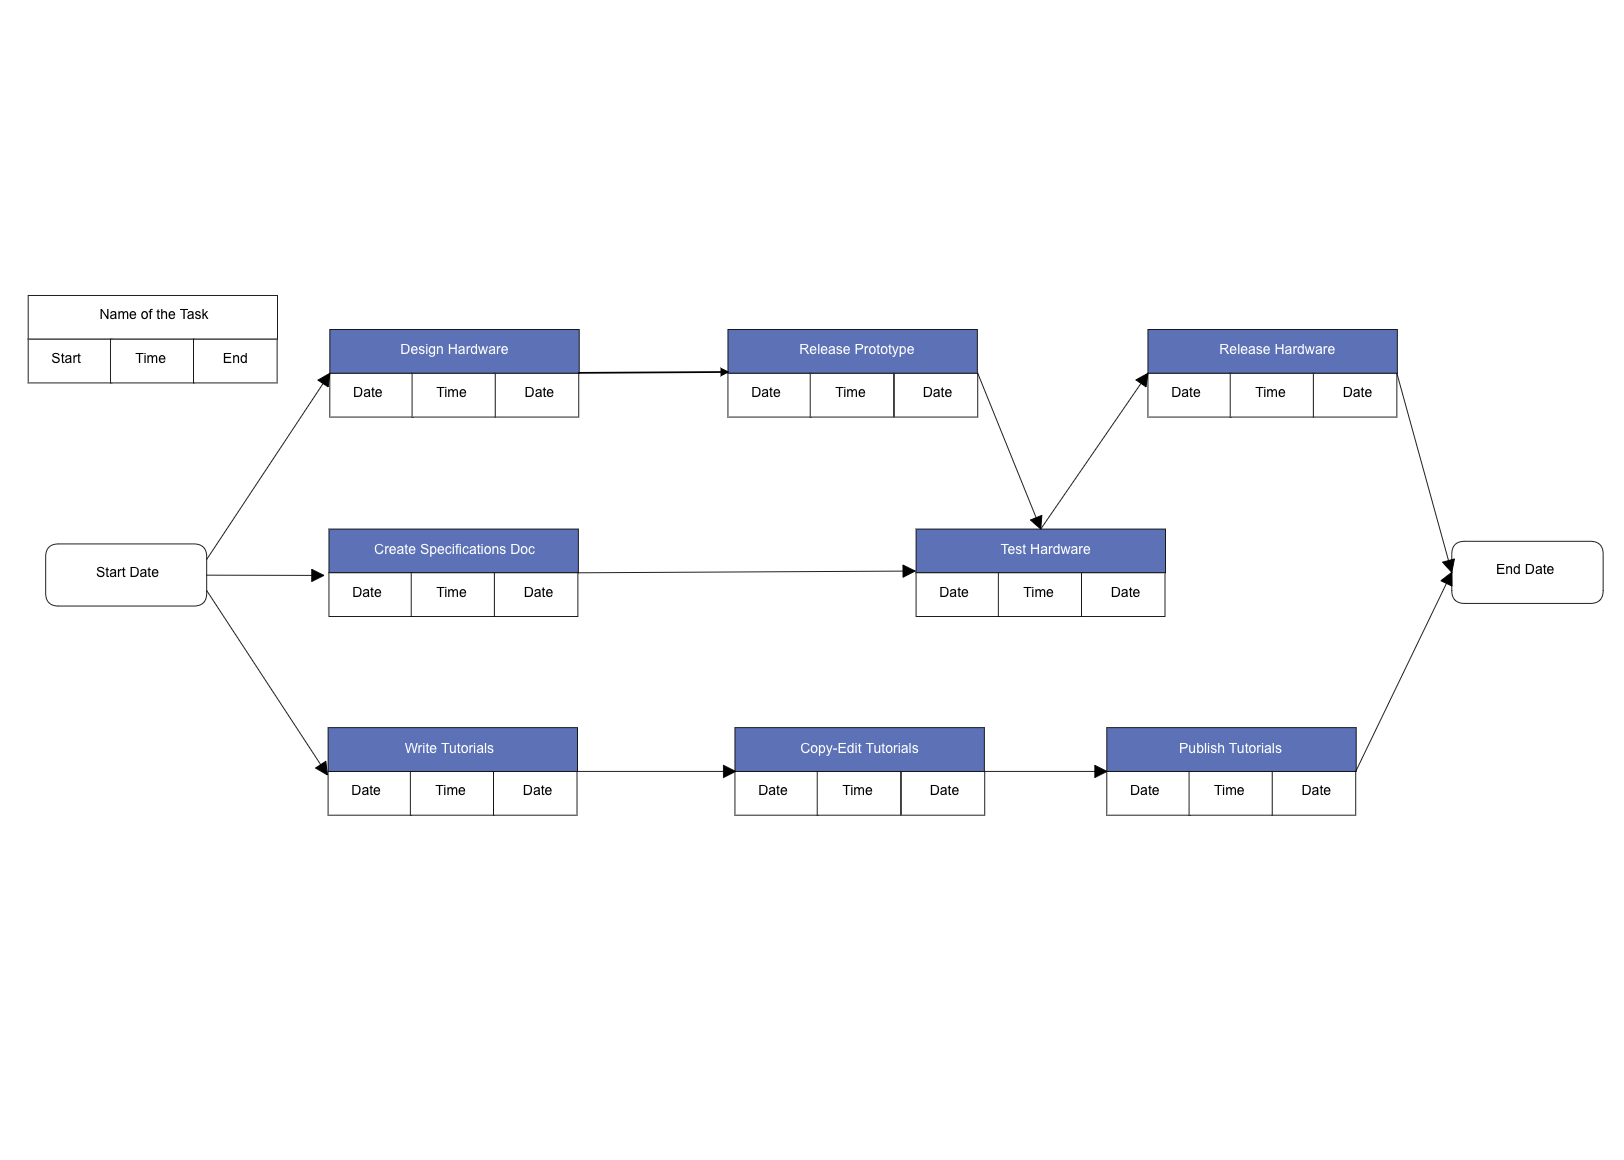
Project managers rely on popular diagrams like Gantt charts to provide a high-level timeline of their projects at a glance. While useful, these charts don’t visualize a key element of task management: dependencies. That’s where another type of diagram comes in — project network diagrams.
What is a project network diagram?
When thinking about network diagrams, most people think of visuals that depict telecommunications networks. However, project network diagrams work more like flowcharts. Rather than describing a physical network of devices, firewalls, and servers, it depicts how each task in a project connects, including which tasks are dependent on one another and which can be completed in tandem.

A project network diagram typically consists of boxes with connecting arrows that show the sequence of activities. Similar to classic flowcharts, each box represents a task. The difference is that a project network diagram depicts a linear schedule of tasks.
The connecting lines are durations of time and make it easy to visualize the length of one task compared to another. As a result, this type of diagram always reads from left to right. A Program Evaluation and Review Technique, or PERT chart, is one example of a project network diagram.
So, why do you need this project management tool, and how will it help your team? There are four major benefits to using this type of illustration.
Identify the most critical tasks
No amount of planning can eliminate every setback. Experienced project managers understand this, and instead of panicking, they set up contingency plans in advance. That’s where precedence diagramming comes in.
The precedence diagram method (PDM) involves charting the dependencies between tasks. Some activities can (or should) happen simultaneously, while others can’t start or begin without the completion of another task. The four dependencies are as follows:
- Start-to-start (SS): Two or more activities that can start at the same time
- Start-to-finish (SS): The task depends on the completion of another activity
- Finish-to-finish (FF): Two or more activities must finish at the same time
- Start-to-finish (SF): The completion of one task depends on the start of another
Plotting out these relationships is the easiest way to visualize the critical path in your project. The critical path is the sequence of activities that has the greatest impact on your project deadline. You can identify it by answering two questions:
- Which activity has the most dependencies?
- From among that list, which activity is the longest?
The task with the greatest impact on the rest of the process, and its dependencies, make up the critical path. Activities along this path must be monitored closely. Tasks that fall outside the critical path are also important, but you have more flexibility to deal with delays.
By learning to manage the critical path, you can resolve hurdles quickly and finish projects on time (or even early).
Estimate time accurately
Since your project network diagrams show how activities are connected from beginning to end, your time estimates can account for not just the work being done, but the order it has to be done. This means more accurate and efficient timelines.
Planning for delays is also an inherent part of the process. Detailed diagrams often list the earliest and latest start times for a project. This planning method challenges you to work backward and consider factors that could slow down the project. You end up with buffer time that gives your team wiggle room in the schedule without drawing out the project deadline overall.
Plus, if anyone on your team has questions about your timeline, it will be easy to justify the logic you used to produce the estimate in the first place.
Make informed decisions
Let’s say your dev team decides to tackle a difficult tech issue with a new strategy, or your stakeholders decide they want to go in a different direction with a particular feature. With your project network diagram in hand, you’ll know exactly which tasks must go in a particular order and which can be completed simultaneously.
By understanding this web of tasks from the start, you can implement new workflows and reroute work without affecting future tasks. In essence, you can make more thoughtful adjustments that won’t derail your project down the line.

Discover opportunities for optimization
A project network diagram gives you the insights you need to be proactive. Did you notice that certain tasks took longer or shorter than expected? Did you discover dependencies that weren’t immediately clear from the get-go?
Use your project network diagrams as a learning tool for perfecting your project management process. Track team performance against your diagram to see where your visuals and/or team are performing unexpectedly and look for solutions.
Tools for project network diagrams
Regardless of your project, you’ll need a quality diagramming tool to create clean and useful project network diagrams. You’ll also need help from your team to understand the ins and outs of every task they have ahead of them. Project network diagrams can’t be created in a vacuum. Like all good work, you’ll need to collaborate with your team to make them successful.
This post was originally published on April 11, 2018, and updated most recently on December 23, 2021.


