- All templates
- Meeting & Brainstorming
- PERT Chart
PERT Chart

Uses of PERT Charts
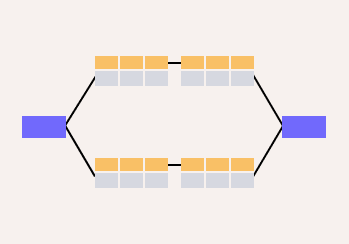
PERT charts offer a simple way to visualize when project tasks start and finish or when they depend on other activities for completion. As a project management staple, PERT chart diagrams can be used in any industry to organize the flow of tasks and make strategic scheduling decisions.
Mapping a project with this method is useful for:
- Identifying the critical path
- Managing task dependencies and potential delays
- Choosing the most time-efficient sequence of tasks
- Deciding how to assign tasks and allocate resources
- Communicating project timelines to stakeholders
Our PERT chart template gives you a hard start on making your team more organized and efficient. Once you’re done making the board, you can use the critical path method (CPM) to determine which steps to prioritize and monitor closely.

How to create your own PERT Chart
Open the PERT Chart in Cacoo. Before you start creating boards, you need to identify the most important phases in the project.
Fill in the name of the project and the start and end dates for this activity.
Then, start from the left side of the board, and add the name and projected dates/duration for the first task in the project. Do the same with the remaining tasks.
Now, redraw the arrows to show the correct sequence of tasks. Some tasks can happen simultaneously, while others can’t begin until another task completes.
Finally, share the board with your team to gain consensus on the schedule and decide the best way to assign responsibilities.
Related tags
You may also like


