- All templates
- Planning & Management
- Gantt Chart Timeline
Gantt Chart Timeline

Uses of Gantt Chart Timelines
Gantt charts are a project manager's go-to tool for tracking the duration of project tasks. By monitoring project timelines one month at a time, you can optimize workflows throughout the entire year. Monthly Gantt charts are especially useful for:
- Planning milestones and deadlines for long projects
- Visualizing and comparing the duration of project phases
- Deciding how to allocate resources efficiently
- Getting buy-in from stakeholders on project timelines
With our Gantt Chart Timeline, you can conveniently define the phases or departmental roles involved in your project for even better workflow management.

How to create your own Gantt Chart Timeline
First, open the Gantt Chart Timeline in Cacoo. Consider the start and end dates of your project.
Once you know how long the project will last, add the months or remove months in the columns to fit your timeline.
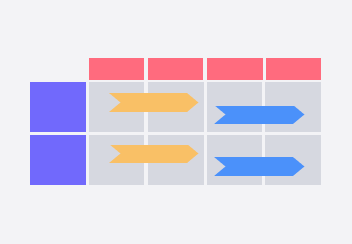
Designate a color for each task. In the included legend, label the arrows to show others which task/phase each color represents.
Going row by row, place color arrows to represent the duration of each task. Each month is further divided into quarters for more precise milestones.
Keep adding arrows of different colors until each task group is represented on the board.
Related tags
You may also like


