- All templates
- Planning & Management
- Gantt Chart Template
Gantt Chart Template
Uses of Gantt Charts
Gantt charts are a project manager's go-to tool for tracking the duration of project tasks. They’re helpful for:
- Visually planning and managing milestones and deadlines
- Monitoring the overall progress of projects
- Deciding how to allocate resources efficiently
- Managing project dependencies and tasks that overlap
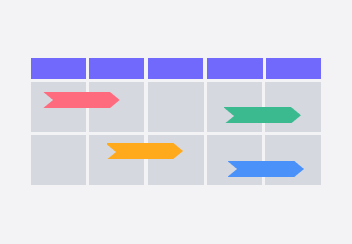
Our template uses a colorful bar chart format, so you can compare the relative timelines of different tasks at a glance.


How to create your own Gantt Chart
First, open the Gantt Chart Template in Cacoo. Consider the start and end dates of your project.
Adjust and relabel the timeline bar to include the correct number of weeks or months for your project.
Designate a color for each task. We recommend creating a legend, so other viewers know which task the color represents.
Decide what task should come first, and place a colored bar on one of the horizontal lines. Now, shorten or length the bar so that it starts and ends at the correct times.
Keep adding bars of different colors until each task group is represented on the board.
Related tags
You may also like


