- All templates
- Planning & Management
- Gantt Chart by Week
Gantt Chart by Week

Gantt Chart by Week
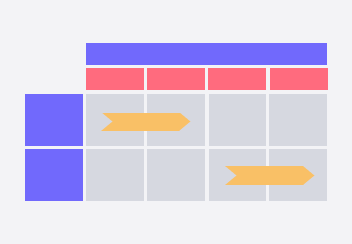
A Gantt chart shows the progression of tasks over time, and it can be used to manage project timelines, dependencies, and resources. Gantt charts also provide a snapshot of the team’s workload at a glance, helping project managers determine whether it’s necessary to rebalance assignments. Equipped with a visual overview of a project, you can do a more efficient job of planning the phases, coordinating cross-team collaboration, evaluating progress, avoiding resource overload, and more.
By involving the entire team in updating the board, you can get everyone on the same page and increase accountability. Get the Gantt Chart by Week in Cacoo, and start planning for success like a time management pro!

How to create your own Gantt Chart by Week
Begin by opening the Gantt Chart by Week in Cacoo. If you like, you can label each column with the exact week.
Now, define the baseline. Consider your starting point and what you need to achieve.
Define the essential activities involved in your project. In other words, break down the baseline into more granular activities. Label the phases in the rows on the left.
Establish the sequence of activities. What tasks need to get done before other activities can start, and what tasks can be done in parallel?
Use the colored bars to define the timeframe for each task or phase.
Related tags
You may also like


