- All templates
- Diagramming & Modeling
- Data Flowchart Template
Data Flowchart Template

Uses of Data Flowchart Templates
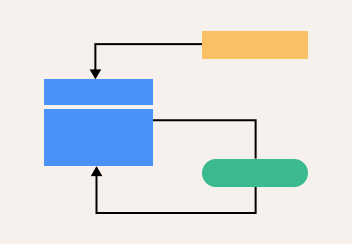
A data flowchart shows how and where data is exchanged and stored in information systems. When handling huge amounts of data, organizations need a structured way to manage and track the flow of information.
Software developers create data flowcharts to map how data moves through a system and any external components involved in the process, such as a customer or authentication server. Also known as data flow diagrams, data flowcharts are used to:
- Design and improve information systems, such as POS software
- Document and manage system requirements
- Illustrate information security protocols
- Plan and implement new data processes
Now that information systems are the backbone of business, you’ll find data flowcharts in use in every industry. Credit card processing, online restaurant ordering, ID verification, and TV streaming services are all examples of information systems that can be mapped with a data flowchart.

How to create your own Data Flowchart
Open the Data Flowchart Template in Cacoo.
Define the starting point of the process. In many cases, the start is an external entity that interacts with the system, such as a customer.
Using the template components, identify where your data will “flow” and where it will be stored.
Remove all the components you don’t need, and redraw the connections between the shapes to define the data path correctly.
Finally, share your flowchart with the team to make sure it’s a good representation of your data process.
Related tags
You may also like


